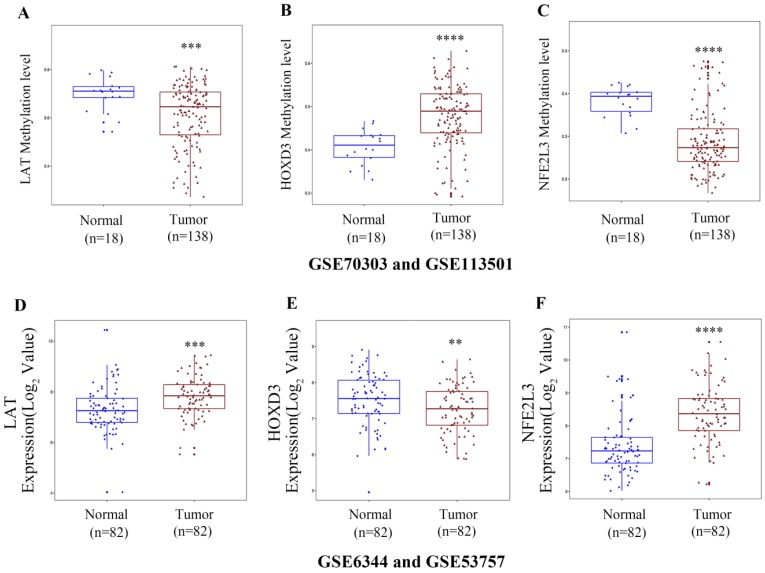
Figure 8.
Boxplot showing gene methylation status and expression levels of DNA methylation-driven genes in GEO datasets. (A-C) DNA methylation status of LAT, HOXD3 and NFE2L3 between normal and ccRCC samples. (D-F) gene expression levels of LAT, HOXD3 and NFE2L3 between normal and ccRCC samples. Two-tailed p value was determined by unpaired t-test, **, p < 0.01, ***, p < 0.001, ****, p < 0.0001.

