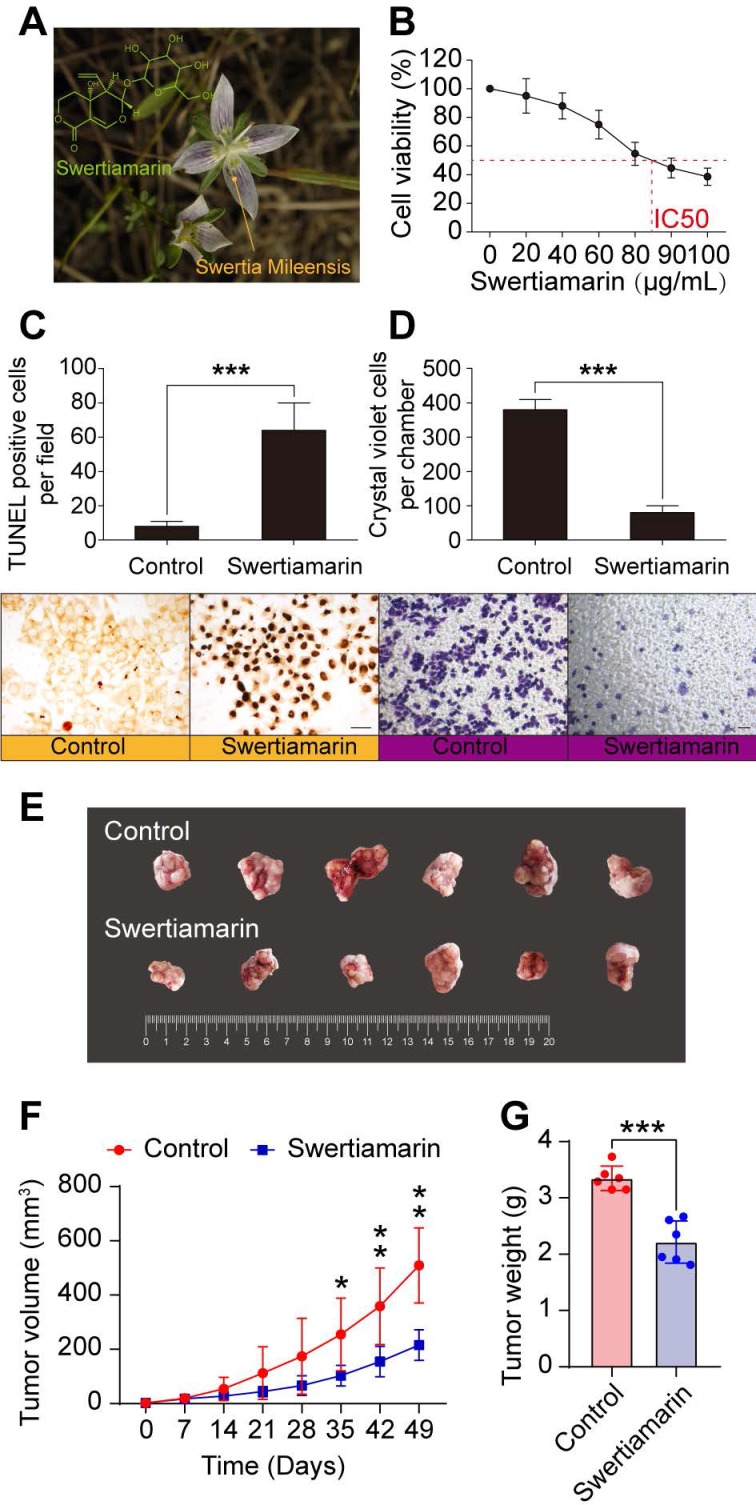
Figure 1.
STM inhibited HCC. A. Chemical structure and the origin of STM. B. STM decreased the viability of HepG2 cells in a dose-dependent manner. C. STM increased the apoptosis of HepG2 cells. D. STM decreased the invasion of HepG2 cells. The data were presented as mean ± SD (n=3). *** P<0.001. Scale bar: 20 μm. E. Tumor tissues dissected from nude mice which received subcutaneous injection of SK-Hep-1 cells. F. Tumor growth curves of each group of nude mice which received subcutaneous injection of SK-Hep-1 cells. G. The weight of tumor tissues dissected from nude mice nude mice which received subcutaneous injection of SK-Hep-1 cells. The data were presented as mean ± SD (n=6). *P<0.05, **P<0.01, ***P<0.001.To select the differentially expressed genes, we used threshold values of ≥2 and ≤-2-fold change and Benjamini-Hochberg corrected p value of 0.05. The data were Log2 transformed and median centered by genes using the Adjust Data function of CLUSTER 3.0 software. Finally, tree visualization was performed using Java Treeview (Stanford University School of Medicine, Stanford, CA, USA).

