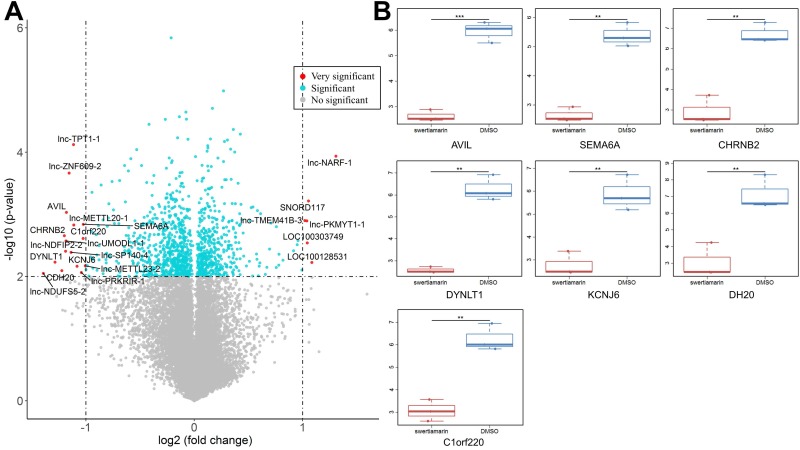
Figure 2.
The differential expressed genes in HepG2 cells treated by STM. A. Differential expressed genes (DEGs) identified in STM treated HepG2 cells. The x-axis is log2 ratio of gene expression levels between two cells; the y-axis is p value based on -log10. The red dots represent the very significantly DEGs (P<0.01 and absolute value of log2(FC)>1 ); the blue dots represent the other DEGs (P<0.01 and absolute value of log2(FC)<=1 ); the gray blue dots represent the transcripts whose expression levels did not reach statistical significance (P>0.01). B. PCR analysis of seven DEGs.

