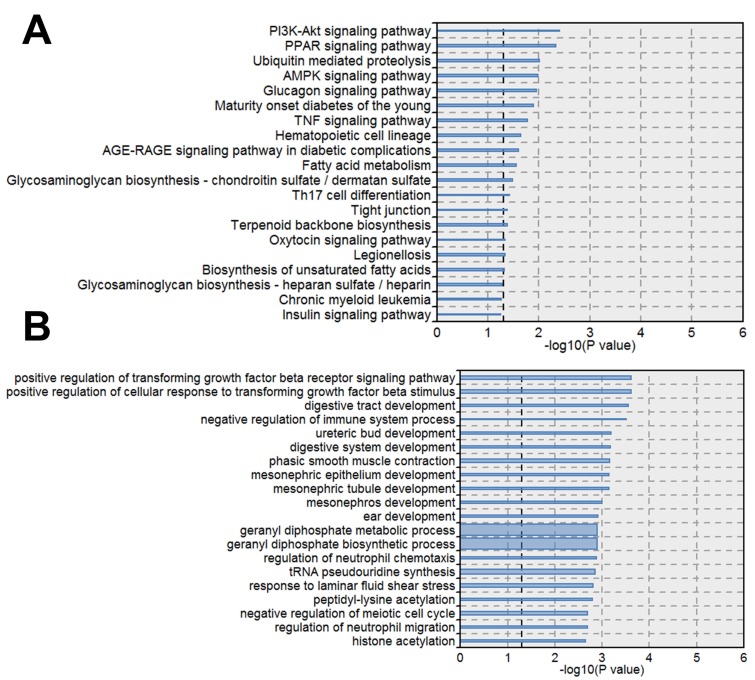
Figure 3.
Pathways and biological processes significantly enriched by differential expressed genes. A. KEGG pathways enriched DEGs. B. Biological Processes enriched DEGs. The line width indicates the enrichment percentage. The dotted line in the box indicates the significance threshold (P value = 0.05).

