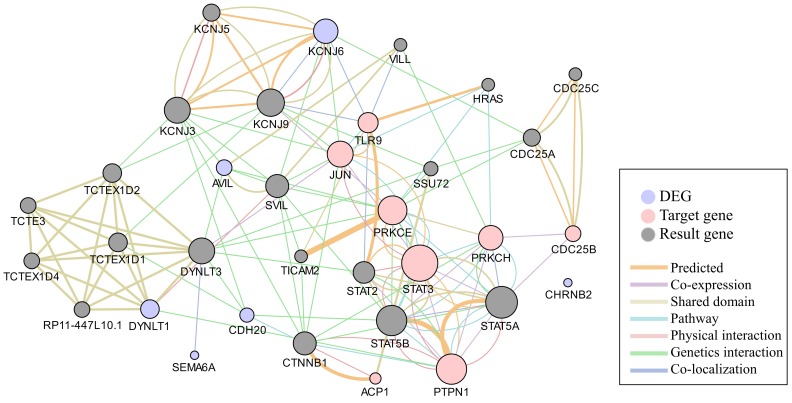
Figure 6.
Network analysis of the consistent targets and the most differential expressed genes. The network shows the predicted functional interaction between the consistent targets (pink circle) and most DEGs (purple circle) according to the Genemania database. The gray nodes represents the result genes involved in the functional interaction between the pink and purple circles. Each colored line represents a different interaction, and the color line width indicates the confidence of the interactions.

