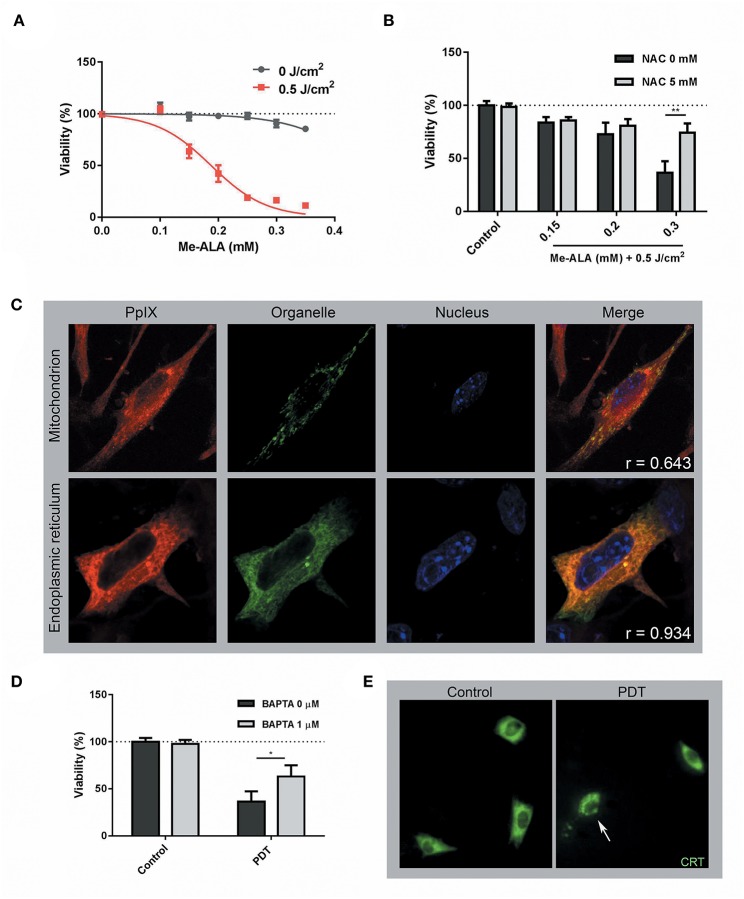
Figure 1.
Photodynamic Therapy induced ER-associated cell death and CRT mobilization on melanoma cells. (A) B16-OVA cells were incubated with increasing concentrations of the pro-drug Me-ALA (0–0.35 mM) for 4 h and then were irradiated with visible light (λ: 635 ± 17 nm, light dose: 0.5 J/cm2). At 24 h post-treatment, cell viability was evaluated through the MTT assay and expressed as a percentage with respect to the non-treated control (dotted line: 100% viability). (B) B16-OVA cells were incubated with Me-ALA (0.1, 0.2, and 0.3 mM) in the presence or absence of NAC (5 mM) for 4 h and then exposed to irradiation (0.5 J/cm2). Viability was evaluated by MTT assay 24 h post-PDT and referred to non-treated conditions (dotted line: 100% viability). Data are mean ± SEM of three independent experiments. **p < 0.01 vs. control group (NAC 0 mM, gray bars), Two-Way ANOVA Bonferroni post-test. (C) B16-OVA cells transfected with pEYFP-Mito (mitochondrial marker) and pEYFP-C1-KDEL-GFP (endoplasmic reticulum marker) were incubated for 4 h with the Me-ALA drug (1 mM). Next, they were fixed with paraformaldehyde (PAF) 4% for 20 min and the cell nuclei were stained with Hoechst (HÖ) for visualization. The fluorescence of PpIX (red), organelles (green), and nuclei (blue) was observed by confocal microscopy. The co-localization is evidenced in yellow color. The analysis of the images was carried out using the free ImageJ 1.42q software (plugging Coloc 2) and the correlation was quantified through the Pearson coefficient (r). (D) B16-OVA cells were subjected to high dose PDT (Me-ALA 0.3 mM + 0.5 J/cm2) in the presence or absence of BAPTA-AM (1 μM) for 4 h. Viability was evaluated by MTT assay 24 h post-PDT and referred to non-treated conditions (dotted line: 100% viability). Data are mean ± SEM of three independent experiments. *p < 0.05 vs. control group (BAPTA 0 μM, gray bars), Two-Way ANOVA Bonferroni post-test. (E) B16-OVA cells transfected with pCRT-EGFP [green fluorescent protein-tagged calreticulin (CRT)] were subjected to high dose PDT (Me-ALA 0.3 mM + 0.5 J/cm2). The fluorescence of CRT (green) was observed by epifluorescence microscopy 0.5 h post-treatment. CRT translocation is marked with a narrow. The analysis of the images was carried out using the free ImageJ 1.42q software.

