Figure 3.
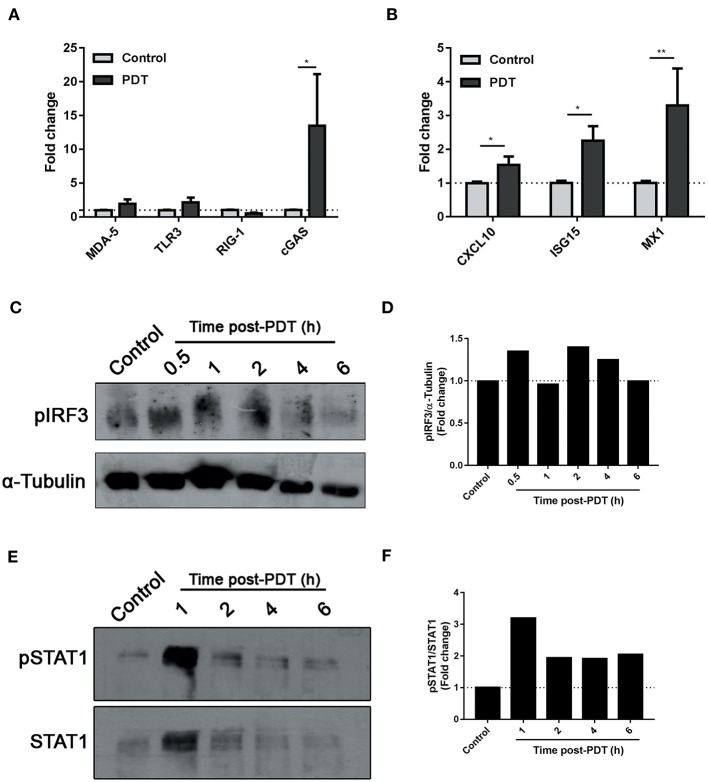
Modulation of IFN-1 pathway by photodynamic therapy. B16-OVA cells were incubated with Me-ALA (0.3 mM) for 4 h and then were irradiated with visible light (λ: 635 ± 17 nm, light dose: 0.5 J/cm2) (PDT). Non-treated cells were used as “Control.” (A) Quantification of mRNA expression of receptors MDA-5, TLR3, RIG-1, and cGAS was performed 14 h after treatment by RTqPCR and normalized with respect to the non-treated control (dotted line: 1). Data are mean ± SEM of three independent experiments. *p < 0.05 vs. control group (untreated cells, gray bars), Two-Way ANOVA Bonferroni post-test. (B) Quantification of mRNA expression of ISGs CXCL10, ISG15, and MX1 was performed 14 h after treatment by RTqPCR and normalized with respect to the non-treated control (dotted line: 1). Data are mean ± SEM of three independent experiments. *p < 0.05, **p < 0.01 vs. control group (untreated cells, gray bars), Two-Way ANOVA Bonferroni post-test. (C) Western blot was performed to detect phospho-IRF3 at 0.5–6 h post-treatment. The same membrane was stripped and reblotted for α-Tubulin as loading control. (D) Densitometric analysis performed with the ImageJ software represented the signal intensity of phospho-IRF3; the signal was normalized α-Tubulin intensity. (E) Western blot was performed to detect phospho-STAT1 at 1–6 h post-treatment. The same membrane was stripped and reblotted for total STAT1 as loading control. (F) Densitometric analysis performed with the ImageJ software represented the signal intensity of phospho-STAT1; the signal was normalized total STAT1 intensity.

