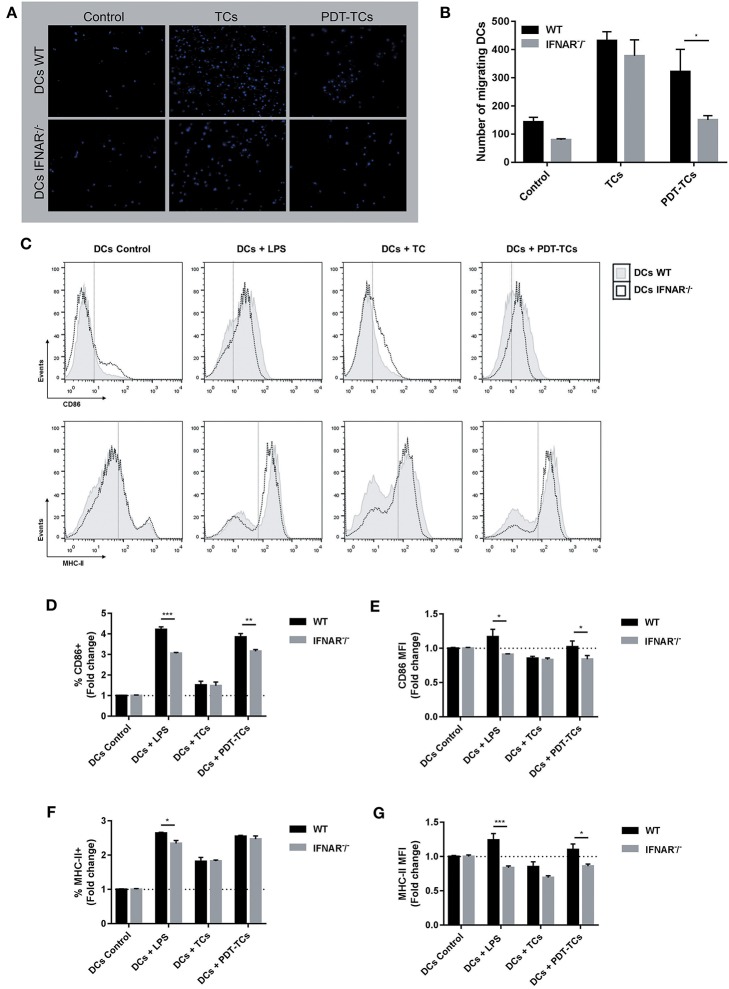
Figure 4.
Phenotypic and functional maturation of dendritic cells mediated by IFN-1 upregulation on PDT-subjected melanoma cells. WT or IFNAR−/− DCs were in the upper chamber of a Transwell apparatus while B16-OVA (TCs) or with PDT-treated B16-OVA (PDT-TCs) were seeded in the lower chamber. Complete growth media was used as “control.” (A) After 16 h at 37°C, DCs that have migrated through the membrane toward the tumor stimuli and attached on the underside of the membrane were stained with Hoechst dye for 1 h, and epifluorescence images were taken. (B) Migrating cells were counted in different fields of view. Data are mean ± SEM of three independent experiments. *p < 0.05 vs. control group (WT dendritic cells, black bars), Two-Way ANOVA Bonferroni post-test. (C) WT (solid line, gray filled) or IFNAR−/− DCs (dotted line, non-filled) were co-cultured with B16-OVA (TCs) or with PDT-treated B16-OVA (PDT-TCs) for 24 h in a 1:1 ratio. As positive control, DCs were exposed to LPS (0.5 μg/mL) for 24 h. CD86 and MHC-II were used as DCs maturation markers. Representative flow cytometry histograms were performed with FlowJo 10.0.7 software. (D) CD86+ cells were referred to untreated imDCs used as negative control (DCs Control, dotted line: 1). Data are mean ± SEM of three independent experiments. **p < 0.01, ***p < 0.001 vs. control group (WT dendritic cells, black bars), Two-Way ANOVA Bonferroni post-test. (E) CD86 expression intensity of CD86+ cells was indicated by geometric mean (MFI, mean fluorescence intensity) referred to untreated imDCs used as negative control (DCs Control, dotted line: 1) Data are mean ± SEM of three independent experiments. *p < 0.05 vs. control group (WT dendritic cells, black bars), Two-Way ANOVA Bonferroni post-test. (F) MHC-II+ cells were referred to untreated imDCs used as negative control (DCs Control, dotted line: 1) Data are mean ± SEM of three independent experiments. *p < 0.05 vs. control group (WT dendritic cells, black bars), Two-Way ANOVA Bonferroni post-test. (G) MHC-II expression intensity of MHC-II+ cells was indicated by geometric mean (MFI) referred to untreated imDCs used as negative control (DCs Control, dotted line: 1). Data are mean ± SEM of three independent experiments. *p < 0.05, ***p < 0.001 vs. control group (WT dendritic cells, black bars), Two-Way ANOVA Bonferroni post-test.

