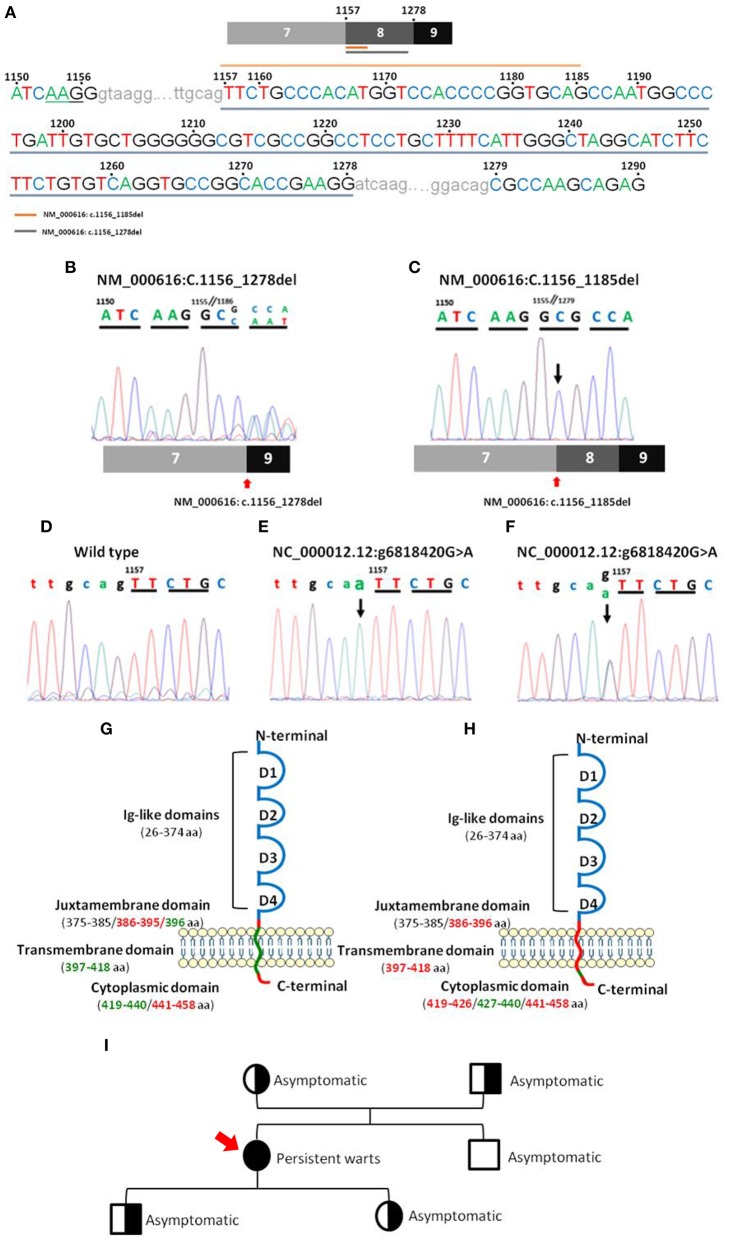
Figure 3.
Nucleotide sequences of CD4 PCR products for the regions of interest and their localization in the CD4 gene. Panel (A) shows a representative sequence of CD4 focused on the region of interest. Gray underlining shows the nucleotide sequence affected by the major deletion (NM_000616: r.1157_1278del), and orange top line shows the nucleotide sequence affected by the minor deletion (NM_000616: r.1157_1185del). Panels (B,C) show mRNA electropherograms obtained from analysis of the minor (NM_000616: r.1157_1185del) and major (NM_000616: r.1157_1278del) deletions detected in the patient's CD4 cDNA, respectively, and the patient's relatives (C). Panels (D–F) show genomic DNA electropherograms from: (D), wild type CD4 gene; (E), patient's homozygous mutated CD4 gene; and (F), heterozygous mutated CD4 gene from the patient's parents and children. Panels (G,H) display a schematic representation of the localization in wild type CD4 protein of the mutated (green) nucleotide bases and the deleted (red) amino acid sequences, including the minor (G) and major (H) deletions, observed in the truncated CD4 cDNA molecules detected in the CD4null patient here reported. Panel (I) shows the family pedigree (men are represented as squares and women as circles), including the key clinical manifestations and, between brackets, the results of CD4 DNA analysis in a coded/graphic format: half-shaded circles and squares, heterozygous DNA; fully shaded circles and squares, homozygous mutated DNA; and unshaded circles and squares, wild type DNA.

