
Figure 5.
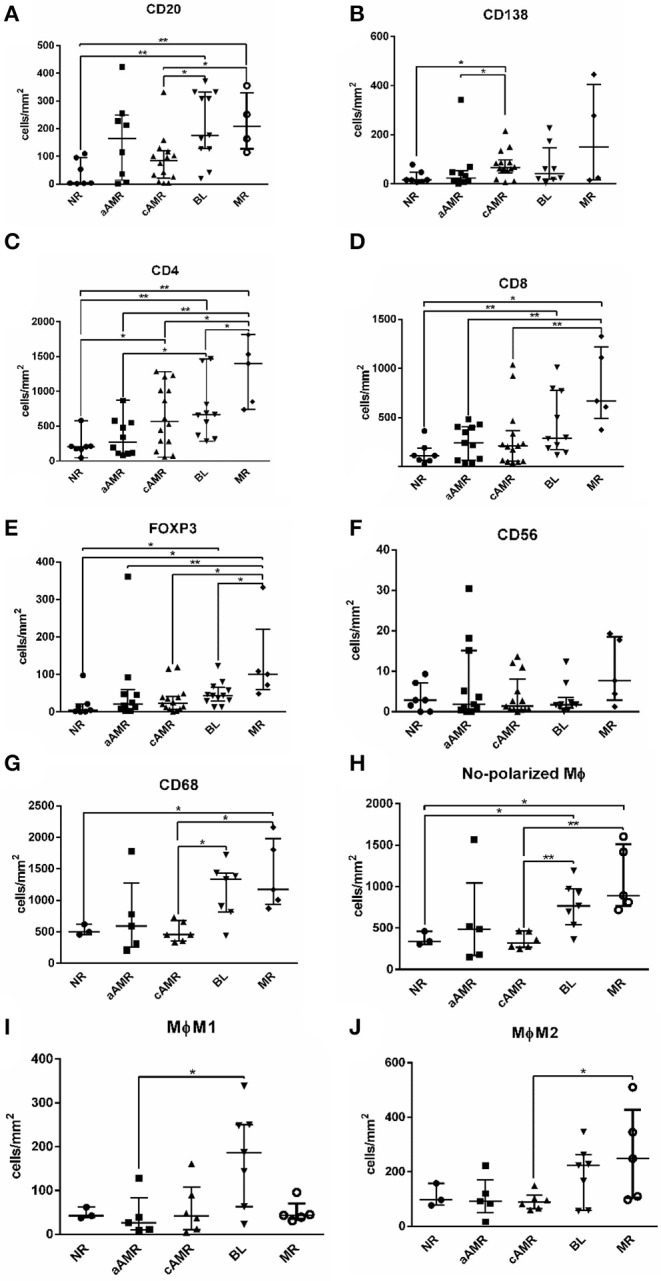
Comparison of the number of cells/mm2 tissue among Banff rejection categories. CD20+ B lymphocytes (A), CD138+ plasma cells (B), CD4+ T lymphocytes (C), CD8+ T lymphocytes (D), FoxP3+ T regulatory cells (E), CD56+ natural killer cells (F), total CD68+ ϕ (G), non-polarized ϕ (H), M1 ϕ (I), and M2 ϕ (J). The results are presented as the median with the interquartile range. *p < 0.05, **p < 0.01. Values plotted as individual black dots represent outliers that fell outside of the upper whisker (the 75th percentile) or the lower whisker (the 25th percentile).