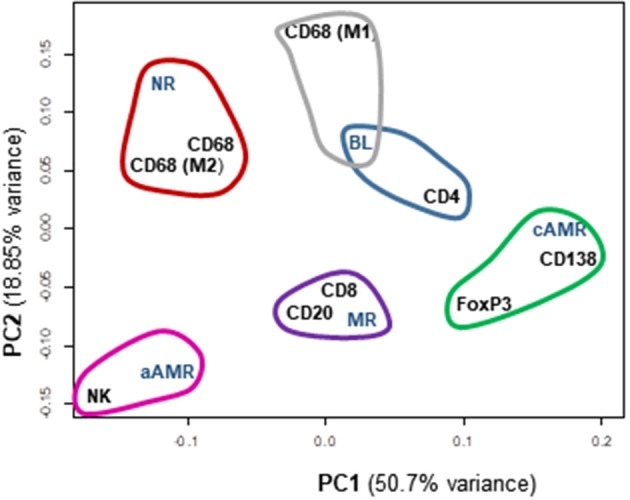
Figure 7.

Principal component analysis (PCA) scatterplot of cellular types of the inflammatory infiltrates among different Banff rejection categories. Clustering of the most similar entities among the rejection categories and all the cellular components is shown. PC1 and PC2 are the two principal component axes. NR, non-rejection; BL, borderline; aAMR, active antibody-mediated rejection; cAMR, chronic active antibody-mediated rejection; MR, mixed rejection.
