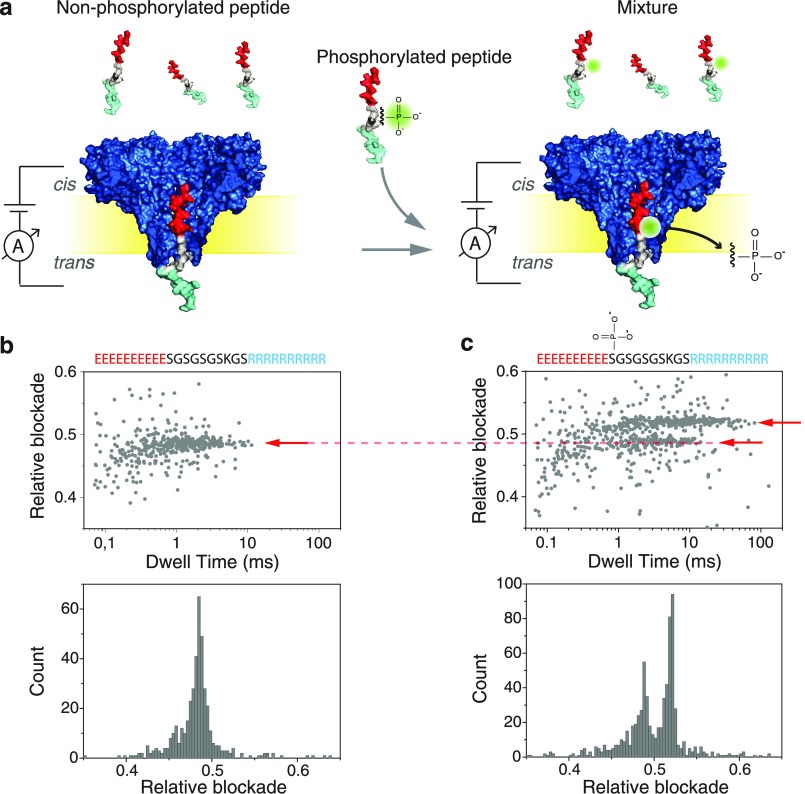
Figure 1.
(a) Schematic representation of the measurement setup, where peptides are driven through a FraC nanopore. Experiments were done with a nonphosphorylated peptide (left) and with an equimolar-concentration mixture of phosphorylated and nonphosphorylated peptides (right). (b) Scatter plot of relative blockade versus dwell time (top), and relative-blockade histogram (bottom) for the nonphosphorylated peptide. (c) Scatter plot of relative blockade versus dwell time for the mixture of phosphorylated and nonphosphorylated peptides. A second population with higher relative blockade is now visible, as shown by the arrows.

