Figure 3.
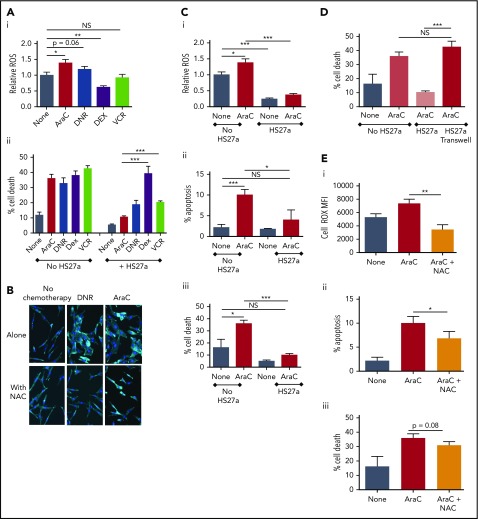
ROS promote CAF formation and MSC-mediated chemoprotection. (A) ROS levels relative to the untreated SEM baseline (1.0), y-axis, after exposure to chemotherapy agents indicated on the x-axis. Percentage cell death (DAPI+, y-axis) of SEM cells exposed to the chemotherapy agents indicated either in monoculture or during coculture with HS27a cells, all shown on the x-axis. Bars show the mean ± SE of 3 independent experiments. All statistically significant comparisons (by unpaired Student t test) are as depicted: (i) ROS level, none vs AraC, P = .0115; none vs DNR, P = .06, and none vs DEX, P = .0035. (ii) Percentage cell death, HS27a AraC vs DEX, P = .0007, and HS27a AraC vs VCR, P = .0003. (B) Phalloidin/DAPI staining of HS27a MSCs alone or exposed to DNR or AraC, with or without 5 mM NAC (original magnification ×20). (Ci) CellROX ROS assay showing the mitochondrial mass (y-axis) of SEM cells in monoculture, baseline set at 1.0, or after coculture with HS27a cells, with or without AraC (x-axis). Statistically significant comparisons (by unpaired Student t test) are as depicted: no HS27a none vs AraC, P = .0115; no HS27a vs HS27a none, P = .0002; and no HS27a+AraC vs HS27a+AraC, P = .0001. (ii) Percentage apoptosis (annexin V+, DAPI−, y-axis) of SEM cells in monoculture, baseline set at 1.0, or after coculture with HS27a cells, with or without AraC (x-axis). All statistically significant comparisons (by unpaired Student t test) are as depicted: no HS27a none vs AraC, P = .0009, and no HS27a+AraC vs HS27a+AraC, P = .0189. (iii) Cell death (DAPI+, y-axis) of SEM cells in monoculture, baseline set at 1.0 or after coculture with HS27a cells, with or without AraC. All statistically significant comparisons (by unpaired Student t test) are as depicted: no HS27a none vs AraC, P = .0102, and no HS27a+AraC vs HS27a+AraC, P = .0001. (D) Cell death (DAPI+, y-axis) of SEM cells in monoculture, with or without AraC, compared with SEM cocultured in contact with HS27a cells or in a Transwell, both with AraC (x-axis). All statistically significant comparisons (by unpaired Student t test) are as depicted: HS27a AraC vs HS27a Transwell+AraC, P = .0002. (E) ROS levels (i), apoptosis (ii), and cell death (iii) (y-axis), with no treatment, AraC treatment, or AraC treatment+NAC (x-axis). Bars show the mean ± SE of 3 independent experiments. Significant reductions in ROS (P = .002) and apoptosis (P = .0479) and a nonsignificant reduction in cell death (P = .08) by unpaired Student t test are shown. *.01 < P ≤ .05; **.001 < P ≤ .01; ***.0001 < P ≤ .001.

