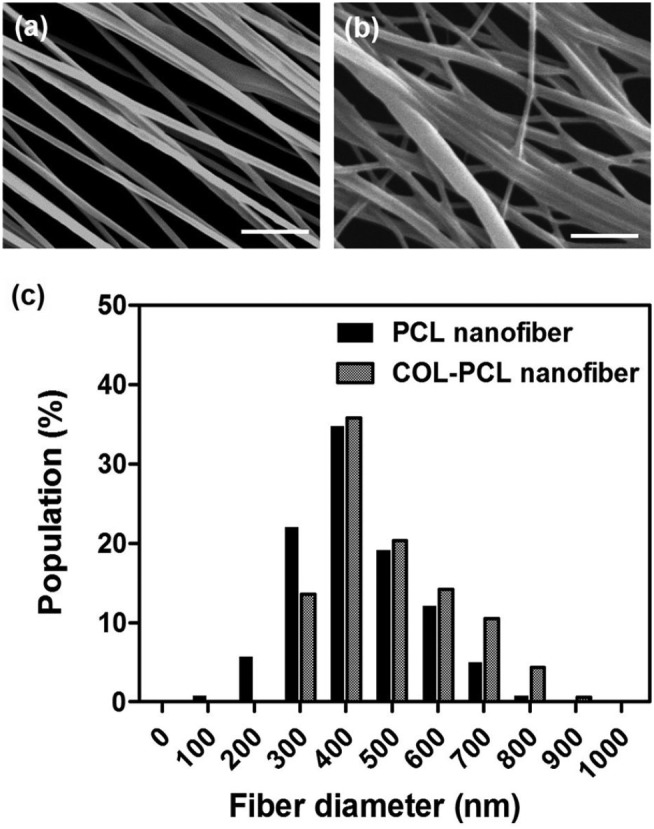
Figure 2.

SEM images of a (a) PCL and (b) a COL-PCL nanofiber membrane. (c) The diameter distribution of the PCL and COL-PCL nanofibers.
Scale bars are 10 µm.

SEM images of a (a) PCL and (b) a COL-PCL nanofiber membrane. (c) The diameter distribution of the PCL and COL-PCL nanofibers.
Scale bars are 10 µm.