Figure 5.

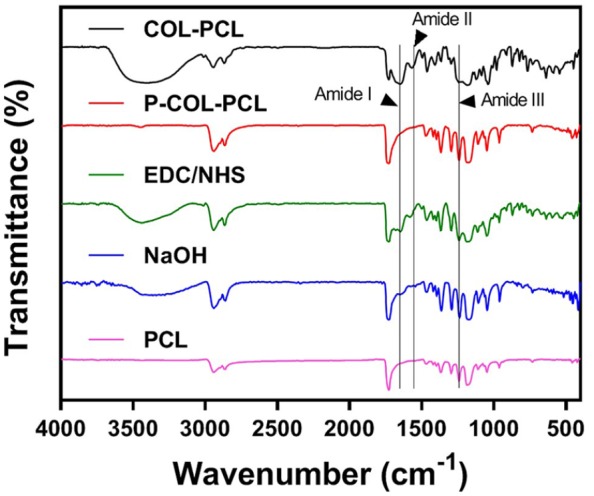
FTIR spectra at wave numbers from 4000 to 500 cm-1 of PCL (purple line), NaOH-treated PCL (blue line), EDC/NHS-treated PCL (green line), P-COL-PCL (red line) and COL-PCL nanofiber (black line).

FTIR spectra at wave numbers from 4000 to 500 cm-1 of PCL (purple line), NaOH-treated PCL (blue line), EDC/NHS-treated PCL (green line), P-COL-PCL (red line) and COL-PCL nanofiber (black line).