
Figure 7.
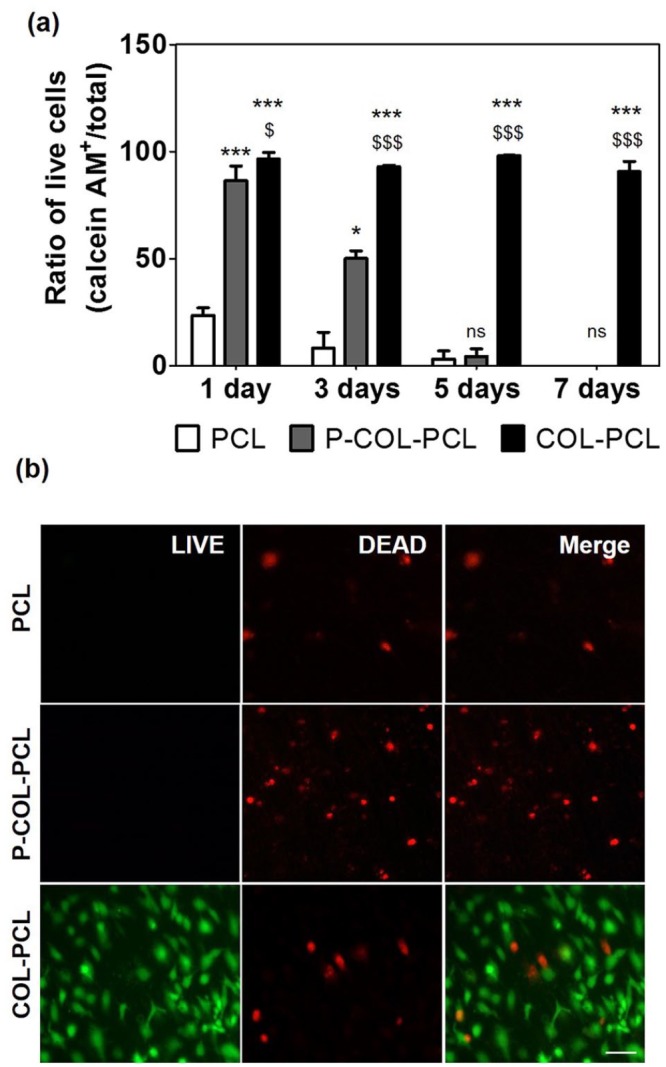
LIVE/DEAD assay of HUVECs on the ultra-thin PCL and COL-PCL nanofiber membrane nanofiber membrane. (a) Ratio of live HUVECs on the PCL and COL-PCL nanofiber membrane. The values shown are means ± SEs (n = 3). * and $ denote statistical significance difference (* and $: p < 0.05, *** and $$$: p < 0.001 and ns: not statistically significant) compared to PCL and P-COL-PCL, respectively. (b) Images of the LIVE/DEAD assay of the HUVECs on the PCL and COL-PCL nanofiber membrane (live and dead cells were stained green and red, respectively, at day 7). Scale bars are 100 µm.