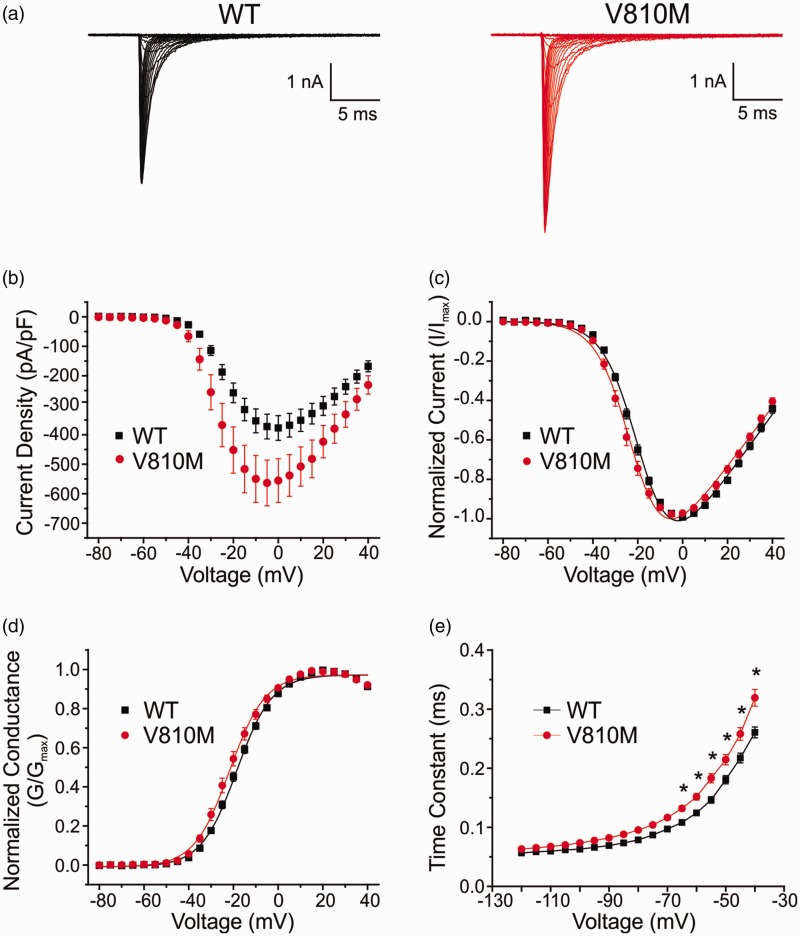
Figure 2.
V810M increases peak current, hyperpolarizes voltage-dependent activation, and delays deactivation of Nav1.7. (a) Representative whole-cell current traces from HEK293 cells transiently transfected with WT (black) or V810M (red) channels. Cells were held at –120 mV and stepped to potentials ranging from –80 to +40 mV in 5 mV increments for 100 ms with 5 s between pulses. (b) Current density for WT (black squares, n = 18) and V810M (red circles, n = 16) channels showing a significant increase in peak current density for V810M. Current density was calculated by normalizing peak currents to cell capacitance. (c) Normalized peak current-voltage relationship for activation of WT (black squares, n = 18) and V810M (red circles, n = 16) channels showing a significant hyperpolarized shift in activation of V810M. (d) Voltage-dependent activation of WT (black squares, n = 18) and V810M (red circles, n = 16) channels showing a small but significant hyperpolarized shift in activation of V810M. Conductance curves were normalized to the maximum conductance value and fit to a Boltzmann equation. (e) Deactivation time constants for WT (black squares, n = 17) and V810M (red circles, n = 11) channels showing significantly slowed kinetics of deactivation for V810M over a voltage range of –65 to –40 mV. Data are expressed as means ± SEM.

