

Abstract
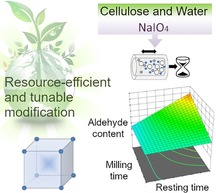
Oxidation of cellulose with periodate under aqueous conditions yields dialdehyde cellulose, a promising functional cellulose derivative. The main obstacles for this oxidation have been its slow kinetics and the dilute reaction conditions, requiring considerable amounts of water and energy. In this study, these drawbacks are overcome by conducting the oxidation at high cellulosic pulp consistency with a cellulose/water weight ratio of 1:4. The oxidizer, cellulose, and water are efficiently mixed in a ball mill. Oxidation occurs mostly in the subsequent step, during the resting time (no further milling/mixing is required). The reaction and resource efficiency of the process are optimized by experimental design and a maximum aldehyde content of 8 mmol g−1 is obtained with a periodate/cellulose molar ratio of 1.25, a milling time of 2 min, and a resting time of 8 h. The developed method allows fine tuning of the oxidation level and is a key step towards the sustainable periodate oxidation of cellulose also on larger scale.
Keywords: cellulose, design of experiments, mechanochemistry, periodate oxidation, renewable resources
Speed and sustainability: The production of dialdehyde cellulose at high consistency, with a cellulose/water weight ratio of 1:4, was optimized through the response surface method. This approach couples high oxidation kinetics with optimal resource efficiency and increases the sustainability and industrial relevance of the periodate oxidation.
Introduction
The need to seek suitable alternatives to nondegradable and fossil‐based plastics is widely acknowledged. In this respect, cellulosic biomass is considered the most likely source of alternative feedstocks; in particular, cellulose derivatives are indispensable materials for many different industrial applications. Among these derivatives, “dialdehyde cellulose” (DAC) is of growing importance. The chemical structure of DAC gives the material a high functionality, which provides many possibilities for follow‐up chemistry. DAC is obtained by selective oxidation of cellulose repeating units by periodate ions, which cause cleavage of the C2−C3 bonds and the formation of aldehyde groups at these positions.1, 2, 3 The dialdehyde groups form reversibly intra‐ and intermolecular hemiacetal and hemialdal bonds, as well as hydrates,4 and are thereby “masked”. In contrast to native cellulose, DAC is soluble in hot water,5 at least at degrees of oxidation above approximately 60 %. In principle, DAC is amenable to the whole range of reactions and derivatizations known for aldehydes from organic chemistry textbooks. DAC can be modified with small aromatic6 or aliphatic amines,7 and can also react with amino‐functionalized biopolymers, such as chitosan8, 9 and collagen.10 These modifications are mostly based on Schiff base reactions.11, 12 Several applications for crosslinked DAC have been reported, ranging from protein or dye absorbers to nanoparticle carriers.13, 14 Moreover, grafted surfaces,15, 16, 17 beads, and gels18, 19, 20, 21 have been prepared from DAC. DAC also raises interest as a precursor to yield more complex materials, such as hollow spheres22 and hairy cellulose nanocrystals.23 The efficiency of periodate oxidation of cellulose and the reactivity of the periodate ions can be influenced by increasing the reaction temperature or by the addition of metal salts as activators.24
Ball milling and wet‐stirred media milling of cellulose is usually used as a purely mechanical treatment to prepare microparticles, nanocrystals, and nanofibers of cellulose,25, 26, 27 or as pretreatments to increase the efficiency of subsequent reactions.28, 29 In general, the effect of ball milling on cellulose is dependent on the intensity of the treatment and mostly reduces the crystallinity of cellulose, whereas effects on the chemical structure, such as the carbonyl content, are little.30
Herein, we describe our efforts to optimize periodate oxidation of cellulose towards faster reaction times and better environmental compatibility, also with the aim to increase the acceptance of cellulose modification on a larger scale. For this purpose, we used short ball‐milling times at high cellulosic pulp consistency followed by a resting time in which the actual oxidation occurred. We further optimized this process by a structured study of the involved factors through design of experiments (DOE). This enabled us to investigate and optimize the parameters of our proposed oxidation route. DOE is a highly efficient technique based on the examination of different factors that are all changed together. It uses a model generated by multiple linear regressions, which allows us to investigate the influence of single factors and their interactions with each other.31 The DOE method is applied in several fields of processes and product developments, also with respect to cellulose products.32, 33, 34 The emergent model can be used to tune the degree of oxidation of the obtained DAC by our ball‐milling approach.
Results and Discussion
Periodate oxidation of cellulose is usually conducted at low solid content (between 1 % and 2 %) and temperatures of up to 48 °C. Conventional reaction times range from 19 h to several days to obtain dialdehyde cellulose with high aldehyde content.1, 21 The low oxidation rate and the resulting long reaction time is a major drawback. In the conventional processes, the cellulose slurry is constantly stirred and heated, requiring a high amount of energy and much water owing to the diluted reaction conditions. As we aimed at increasing the efficiency of the periodate oxidation process, this evidently meant decreasing the amount of required resources (in the form of water and energy). After some preliminary method screening, we used ball milling as a means to efficiently mix cellulose, sodium metaperiodate, and water at high consistency. Subsequently, the reaction mixture was transferred into a closed vessel and left resting. Oxidation occurred mostly during this equilibration time (Figure 1).
Figure 1.
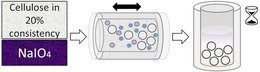
High‐consistency cellulose (cellulose/water ratio of 1:4) and sodium metaperiodate were mixed together by vibrational ball milling. Oxidation of cellulose occurred during equilibration of the reaction mixture in the dark.
Experimental design and model
The reaction parameters of the high‐consistency periodate oxidation were optimized by an experimental design study. The experimental matrices of the runs, randomized by the software, are listed in Table 1, including the aldehyde contents of the samples, that is, the response, measured by oxime reaction.
Table 1.
Matrix of sample runs with the experimental conditions, the respective points in the space of design, the block subdivision, and the response results.[a]
|
Run |
Space type |
A [min] |
B [h] |
C [equiv.] |
Response [mmol g−1] |
Block |
|---|---|---|---|---|---|---|
|
1 |
factorial |
20 |
1 |
2 |
2.8 |
1 |
|
2 |
factorial |
20 |
8 |
1.25 |
4.6 |
|
|
3 |
factorial |
20 |
8 |
2 |
2.4 |
|
|
4 |
factorial |
20 |
1 |
1.25 |
4 |
|
|
5 |
factorial |
2 |
8 |
1.25 |
7.7 |
|
|
6 |
factorial |
2 |
8 |
2 |
6.5 |
|
|
7 |
center |
11 |
4.5 |
1.625 |
3.9 |
|
|
8 |
center |
11 |
4.5 |
1.625 |
3.3 |
|
|
9 |
factorial |
2 |
1 |
1.25 |
3 |
|
|
10 |
factorial |
2 |
1 |
2 |
2.7 |
|
|
|
|
|
|
|
|
|
|
11 |
axial |
11 |
8 |
1.625 |
3.9 |
2 |
|
12 |
axial |
11 |
4.5 |
1.25 |
3.5 |
|
|
13 |
axial |
11 |
4.5 |
2 |
3 |
|
|
14 |
axial |
11 |
1 |
1.625 |
1.1 |
|
|
15 |
axial |
2 |
4.5 |
1.625 |
3.5 |
|
|
16 |
center |
11 |
4.5 |
1.625 |
2.4 |
|
|
17 |
axial |
20 |
4.5 |
1.625 |
2.6 |
[a] A=milling time; B=resting time; C=ratio NaIO4/cellulose (molar equiv.); response=aldehyde content.
The analysis of variance is summarized in Table 2. The probability values (p) of the factors and factor interactions were used to evaluate their significance, at a cutoff value of p=0.05 (corresponding to the common value for the alpha level in right tail event tests). All factors and the interaction of factors A (milling time) and B (resting time) were below this cutoff and hence significant. The interactions of factors B and C (ratio NaIO4/cellulose), as well as A and C, were not significant and were therefore disregarded for the model calculation. In addition, the calculated Fisher–Snedecor distribution value (F) of the model, computed from the mean square of the model and the mean square of the residual, has a bigger value than the tabulated F value of 3.36 (degrees of freedom of 4 and 11 at 95 % confidence level), indicating the significance of the model. Following the same criteria, the calculated F value, considering the lack of fit and the pure error mean square, is much smaller than the tabulated F value of 241.88 (degrees of freedom of 10 and 1 at 95 % confidence level), suggesting a good fitting of the model with the considered factors. This is also indicated by the coefficient of determination (R 2) of 0.91 and the adjusted R 2 value of 0.87, which are close to 1 (see the Supporting Information, Table S1).
Table 2.
Analysis of variance (ANOVA) for the response surface two‐factor interaction model.[a]
|
Source |
SS |
DF |
MS |
F |
p |
|---|---|---|---|---|---|
|
Block |
6.26 |
1 |
6.26 |
– |
– |
|
Model |
29.65 |
4 |
7.41 |
26.7 |
<0.0001 |
|
A |
4.90 |
1 |
4.90 |
17.65 |
0.0015 |
|
B |
13.22 |
1 |
13.22 |
47.64 |
<0.0001 |
|
C |
2.92 |
1 |
2.92 |
10.50 |
0.0079 |
|
A B |
8.61 |
1 |
8.61 |
31.02 |
0.0002 |
|
Residual |
3.05 |
11 |
0.2776 |
– |
– |
|
Lack of fit |
2.87 |
10 |
0.2874 |
1.60 |
0.5529 |
|
Pure error |
0.18 |
1 |
0.18 |
– |
– |
|
Cor total |
38.96 |
16 |
– |
– |
– |
[a] SS=sum of squares; DF=degrees of freedom; MS=mean square; A=milling time; B=resting time; C=ratio NaIO4/cellulose (molar equiv.); response=aldehyde content.
The diagnostic plots (Figure S1) were used to further validate the model through the analyses of residuals and the predicted versus actual points. The normal plot versus residuals follows a linear distribution. The residuals versus the predicted values and versus the block showed a random scatter with no outliers, indicating the absence of heteroscedasticity and no influence of the subdivision in blocks. The predicted versus actual showed randomly scattered points along the 45° line. These results confirmed our assumptions based on the used model with the analysis of variance.
The influence of factor A, the milling time, and factor B, the resting time, on the aldehyde content of the oxidized cellulose is shown in the response plot in Figure 2 (using 1.25 equivalents of NaIO4 as factor C). As the interaction of factors A and B is significant (see Table 2), this is reflected as well in the response plot; a long resting time in combination with a low milling time yields the highest aldehyde content of 7.7. Increasing the milling time is, in contrast, rather counterproductive, since 20 min of milling gives considerably lower aldehyde content and almost no further oxidation occurs during the resting time. The ratio NaIO4/cellulose (Factor C) has a negative effect on the aldehyde content (Figure S2); increasing the equivalents of periodate, decreased the aldehyde content. At higher equivalents of periodate, the powder to media ratio and the filling volume increase. We believe that this lowers the mixing efficiency, explaining the decrease in reaction efficiency. However, this hypothesis needs further investigation, which is beyond the scope of this work. The optimized model is described by Equation (1):
| (1) |
Figure 2.

The influence of factor A, the milling time, and factor B, the resting time, on the aldehyde content, visualized as a response surface plot. The equivalents of periodate based on the cellulose monomer units (factor C) was fixed at 1.25.
The method was further validated by following the predicted reaction conditions (Table 3). We predicted the parameters to synthesize dialdehyde cellulose with either low aldehyde content (≤3 mmol g−1), medium aldehyde content (between 3 mmol g−1 and 5.8 mmol g−1), or high aldehyde content (≥5.8 mmol g−1). Variations of the used experimental conditions in the sample run matrix (Table 1) were chosen deliberately to evaluate the model. The actual aldehyde contents were measured by oxime titration. Taking into account a previously determined relative standard deviation of 14 % of the oxime reaction, the measured values were statistically in good agreement to the predicted ones, corroborating the developed model. We chose two samples from Table 3 for further characterization and analysis; run 2 (referred to as DAC_34 %) with an degree of oxidation of 34 % and run 3 (DAC_64 %) with an oxidation level of 64 %.
Table 3.
Validation runs with the values predicted by the model and the actual values measured by oxime titration. Predicted values were calculated from the optimized model in Equation (1).
|
Run |
A |
B |
C |
Aldehyde content [mmol g−1] |
|
|---|---|---|---|---|---|
|
|
[min] |
[h] |
[equiv.] |
Predicted |
Actual[b] |
|
1 |
2.0 |
7.9 |
1.625 |
6.3 |
6.9 |
|
2[c] |
2.4 |
5.0 |
1.625 |
4.5 |
4.2 |
|
3[c] |
2.0 |
8.0 |
1.25 |
6.9 |
8.0 |
|
4 |
2.0 |
8.0 |
2.00 |
5.8 |
5.0 |
|
5 |
2.0 |
1.0 |
2.00 |
1.4 |
0.9 |
|
6 |
11 |
4.5 |
1.25 |
4.0 |
4.0 |
|
7 |
20 |
8.0 |
2.00 |
2.3 |
2.5 |
[a] A=milling time; B=resting time; C=ratio of NaIO4/cellulose (molar equiv.)[b] Mean values from duplicate measurements. [c] Run 2 is denoted as DAC_34 % and run 3 as DAC_64 %.
In summary, the experimental design approach was successful in determining the significant factors and optimizing the reaction conditions. The diagnosis of the two‐factor interaction (2FI) model confirmed the significance and reliability of the model, as well as the used experimental conditions. The equation of the validated model in Equation (1) allowed a reliable prediction of the experimental conditions to synthesize dialdehyde cellulose with different degrees of oxidation.
Effect of the oxidation on the chemical structure and morphology of cellulose
Figure 3 shows the FTIR spectra of DAC_34 % and DAC_64 % (Table 3, runs 2 and 3, respectively), and the milled pure cellulose (milled Avicel) as a blank. The carbonyl and C−H stretching bands from the aldehyde group at 1730 cm−1 and at 2880 cm−1, respectively,1, 8 are rather weak as the carbonyls are mainly present in masked forms (see Introduction). This is generally observed for carbonyl structures in cellulosic matrices.35 The hemiacetal signal is also detected at 880 cm−1 (strong band). In addition, we compared the IR spectra of native and milled cellulose to rule out any significant effect of ball milling on the chemical structure (Figure S3). Both spectra feature the same characteristic bands and, as expected, no significant difference was found.
Figure 3.
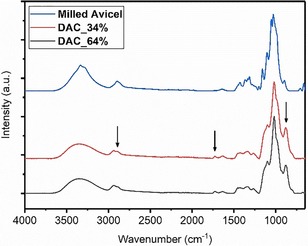
FTIR spectra of dialdehyde cellulose with 34 % and 64 % degrees of oxidation in comparison to milled cellulose (Avicel). The arrows highlight the discernible IR bands corresponding to the aldehyde structures.
It is well known that ball milling affects the morphology of cellulose, but it can also alter the chemical structure. Even a short dry milling for 15 min can reduce the crystallinity and molar mass of cellulose.30 Under our optimized reaction conditions, cellulose was milled for only 2 min in a wet state, and the effect of this treatment was rather small. The crystallinity index (measured by FTIR spectroscopy) was reduced from 0.98 to 0.88. In contrast to this, the morphology of the cellulose particles is affected more significantly, as shown by scanning electron microscopy (SEM; Figure 4).
Figure 4.
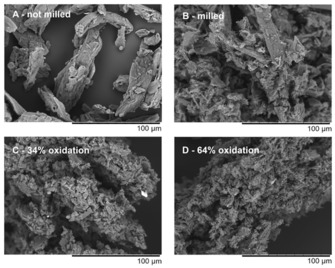
SEM images of native cellulose (A) and ball‐milled native cellulose (2 min treatment, B), in comparison to dialdehyde cellulose with a medium oxidation level of 34 % (C) and a high level of oxidation of 64 % (D).
In comparison to native cellulose (Figure 4 A), ball milling for 2 min reduced the size of cellulose particles and partly fibrillated their surface (Figure 4 B). This increased the surface area and chemical accessibility of the sample,26 which boosts the efficiency of the heterogeneous periodate oxidation, starting from less ordered towards more crystalline regions.1, 36 Following this argument, one would expect an elevation of reaction efficiency if the ball milling time is increased. However, our results (Figure 2) showed exactly the opposite. We suggest that increasing the severity of ball milling either causes periodate decomposition and side reactions induced on collision by friction energy or compacts oxidized regions by enforcing intermolecular hemiacetal linkages, which decreases accessibility and hinders further oxidation. At present, however, both assumptions are unproven and remain speculative.
The SEM images of the oxidized samples (Figure 4 C and D) are very different to those of the non‐oxidized cellulose. The surface of the samples seems to be etched by the periodate treatment, resulting in rough and highly porous structures. This observation suggests that the oxidation proceeded from the particle surface to the inside of the material as reported in the literature,36 and not only from the amorphous domains. The sample DAC_64 % (Figure 4 D) is more porous and more strongly fibrillated than DAC_34 % with a lower level of oxidation (Figure 4 C).
In previous reports, milling‐induced periodate oxidation of cellulose was carried out by using very intensive milling for up to 180 min, giving a low aldehyde content of 0.9 mmol g−1,25 and a content of 1.84 mmol g−1 when metal salts were used as activators.37 This is much more severe and energy‐intensive than our procedure, which also yields far higher degrees of oxidation. The sample DAC_64 % features an almost ten‐times higher degree of oxidation at a milling time of only 2 min (Table 3). Oxidation of our sample occurred mostly during the subsequent resting time, without the need of any additional energy input in the form of mixing or heating.
Conducting the oxidation at high consistency also facilitates the purification of cellulose from the reaction mixture. Much less water for washing is required. The consumed sodium periodate can be recycled efficiently, according to our previously reported environmentally compatible process with ozone instead of chlorine‐based oxidants,38 which increases the overall sustainability of the process.
Conclusions
Periodate oxidation was conducted by using an initial short period of ball milling followed by a resting time, at high consistency with a cellulose/water ratio of 1:4. The efficiency of the periodate oxidation was thereby increased considerably while minimizing the input of energy and the amount of water. The approach was further optimized in an experimental design and the resulting two‐factor interaction model was validated. Efficient mixing of cellulose, water, and oxidizing agent was realized by a short ball milling treatment. After milling, the actual oxidation reaction occurred during simple resting of the reaction mixture without stirring or heating. When the oxidation was conducted with 1.25 equivalents of NaIO4, a milling time of only 2 min and a resting time of 8 h, a high cellulose aldehyde content of 8 mmol g−1 was reached. The established reaction model can be used to predict conditions needed to obtain DAC with certain degrees of oxidation and the experimental setup can be transferred to larger scale. It combines high oxidation rates with optimized resource efficiency, thereby increasing the sustainability and industrial relevance of the process. We are thus confident that the optimized setup provides a technically robust, economically acceptable, and environmentally tolerable basis for production of DAC on a larger scale, as it is currently envisioned in several biorefinery scenarios in the pulp and paper industries.
Experimental Section
Materials
All chemicals, including microcrystalline cellulose (Avicel PH101), sodium metaperiodate (ACS reagent, ≥99.8 %), hydroxylamine hydrochloride (ACS reagent, 99.0 %), glycerol (99 %), tert‐butyl alcohol (tBuOH; 99.3 %), and solutions of sodium hydroxide (NaOH) and 0.1 m hydrochloric acid (HCl),were purchased from Sigma–Aldrich and used without further purification.
Methods
Ball milling and oxidation
Avicel (1.0 g, 6.2 mmol of monomer units, 1.0 equiv.), water (4 mL) and the respective amount of sodium metaperiodate for each experiment were transferred into a grinding jar (25 mL in volume, coated with polytetrafluoroethylene). The amount of metaperiodate used is described in equivalents of metaperiodate based on the cellulose monomer units, and was varied between 1.25 equivalents (7.7 mmol, 1.65 g) and 2 equivalents (12.3 mmol, 2.64 g). The amounts used are defined as the NaIO4/cellulose ratio in the experimental design. Two grinding balls (zirconium oxide, 12 mm in diameter) were added and milling was conducted in a vibrational mill (Retsch CryoMill, Retsch GmbH, Germany) at 25 Hz for the respective milling time. According to Schmidt et al.,39 the temperature peak can reach up to 45 °C during 20 min of dry ball milling taking into account our parameters. However, as we performed the experiments in the presence of water (wet milling) and considering also the shorter experiment times, we assume that all the experiments were conducted at room temperature. We used a coated grinding jar and nonmetal grinding balls to avoid side reactions, corrosion, and the danger of explosions (see depiction of the method in Figure 1). After the milling, the reaction mixture was transferred into vials and kept in the dark for different resting times. The absence of light is important in this step to avoid photodecomposition of the periodate salt. Then, the reaction was quenched with glycerol (10 mL) and the product was washed twice with water (150 mL each) by centrifugation (4000 rcf for 15 min). The products after the reaction have a sponge‐like consistency and they are easy to recover from the vials. DAC_34 % and DAC_64 % were dried according to a special protocol for SEM analysis (see SEM analysis section below for more information). The other samples were frozen at −80 °C and freeze‐dried in a lyophilizer (Christ Beta 1–8 LD Plus, Martin Christ Gefriertrocknungsanlagen GmbH, Germany).
Aldehyde content determination by oxime titration
Samples of freeze‐dried DAC were used for the oxime reaction with a 0.25 m hydroxylamine hydrochloride solution in water. Briefly, dried DAC (0.1 g) was suspended in water and the solution of hydroxylamine (25 mL) was added. The pH was then adjusted to 4 with NaOH and HCl solution (both 0.1 m). In addition, a blank sample with only DAC and water without hydroxylamine solution was prepared and adjusted to pH 4. All samples were gently stirred or shaken for 90 h at room temperature in the dark. Then, the samples were titrated to pH 4 with NaOH solution. The volume of NaOH (in mL) is defined as V c for the sample with hydroxylamine solution and V b for the blank sample. The analyses were conducted in duplicate. The aldehyde content is then determined according to Equation (2), 4, 12
| (2) |
The degree of oxidation (in percentage) was determined from the ratio of actual aldehyde content and the aldehyde content of 100 % oxidized cellulose equaling 12.5 mmol.
FTIR spectroscopy and SEM analyses
The freeze‐dried DAC samples with 36 % and 64 %oxidation, the freeze‐dried milled cellulose, and the unmilled cellulose (Avicel) samples were analyzed with a PerkinElmer Frontier FTIR Single‐Range spectrometer in ATR mode (PerkinElmer Frontier, Waltham, MA, United States). The crystallinity index was determined according to the method proposed by Nelson and O'Connor40, 41 to evaluate the effect of the ball milling on the crystallinity of cellulose (Avicel vs. milled Avicel).
For SEM analysis, a special freeze‐drying protocol was used to avoid the ice‐templating effect of water, according to the literature.42 The samples were first solvent‐exchanged with a 1:1 v/v solution of water and tBuOH overnight. Afterwards, excess solvent was removed by centrifugation and decantation, and the cellulose sample was solvent‐exchanged to neat tBuOH. In each solvent exchange, the volume of the solution corresponded to approximately ten times the volume of the cellulose sample. Solvent exchange was conducted at 30 °C to avoid solidification of the tBuOH‐rich suspension (tBuOH is a solid at room temperature). The solvent‐exchanged samples were then frozen at −80 °C and freeze‐dried. A native cellulose was pre‐milled without addition of periodate to study the effect of the milling on the cellulose structure, this sample was freeze‐dried the same way as the DAC samples for SEM analysis. All samples were sputtered prior to SEM analysis with a 5 nm platinum layer by using a Leica EM ACE 200, and analyzed with a TM3030 tabletop scanning electron microscope (Hitachi, Tokyo, Japan).
Experimental design
The selected design for the experiments was the central composite design (CCD), with a face‐centered (FC) design (see Figure 5). Alpha (the position of the axial level points) of one equals the center of the cube faces in a three‐factor design of a two‐level experimental space. The three chosen factors were milling time (A), resting time (B), and ratio of equivalents of sodium periodate based on cellulose monomer unit (C), with the ranges listed in Table 4.
Figure 5.
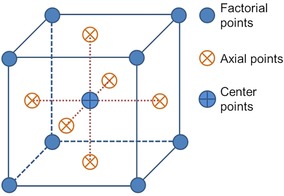
Graphic representation of the central composite design with a face‐centered model.
Table 4.
Factors used in the experimental design.
|
|
Low level |
High level |
Central |
|---|---|---|---|
|
A: Milling time [min] |
2 |
20 |
11 |
|
B: Resting time [h] |
1.0 |
8.0 |
4.5 |
|
C: Ratio NaIO4/cellulose [equiv.] |
1.25 |
2 |
1.625 |
The generated model is based on these factors and the 2FI and it is described by Equation (3) to predict the the aldehyde content Y:
| (3) |
The coefficients (a 0, a 1, etc.) in Equation (3) were calculated from the experimental data by multiple regression analyses. Analysis of variance and F test were used to select the significant coefficients and to evaluate, in combination with the coefficient of determination (R 2) and the diagnostic plots, the statistical significance of the model. The model was then used to predict the validation samples and to build a response surface to tailor the aldehyde content by using the optimal values of each factor. The experimental runs were divided for feasibility reasons into two blocks, corresponding to two days. This was also taken into account in the data analysis and the model was then validated through additional experiments. The software Design Expert 11 (StatEase, Minneapolis) was used to build the design and analyze the data.
Conflict of interest
The authors declare no conflict of interest.
Supporting information
As a service to our authors and readers, this journal provides supporting information supplied by the authors. Such materials are peer reviewed and may be re‐organized for online delivery, but are not copy‐edited or typeset. Technical support issues arising from supporting information (other than missing files) should be addressed to the authors.
Supplementary
Acknowledgements
The authors are grateful to the Austrian Research Promotion Agency (FFG—Österreichische Forschungsförderungsgesellschaft, Project Nr. 855592) for financial support.
A. Lucia, H. W.G. van Herwijnen, J. T. Oberlerchner, T. Rosenau, M. Beaumont, ChemSusChem 2019, 12, 4679.
Contributor Information
Prof. Dr. Thomas Rosenau, Email: thomas.rosenau@boku.ac.at.
Dr. Marco Beaumont, Email: marcobeaumont1@gmail.com.
References
- 1. Kim U.-J., Kuga S., Wada M., Okano T., Kondo T., Biomacromolecules 2000, 1, 488–492. [DOI] [PubMed] [Google Scholar]
- 2. Potthast A., Kostic M., Schiehser S., Kosma P., Rosenau T., Holzforschung 2007, 61, 662–667. [Google Scholar]
- 3. Siller M., Amer H., Bacher M., Roggenstein W., Rosenau T., Potthast A., Cellulose 2015, 22, 2245–2261. [Google Scholar]
- 4. Münster L., Vícha J., Klofáč J., Masař M., Kucharczyk P., Kuřitka I., Cellulose 2017, 24, 2753–2766. [Google Scholar]
- 5. Kim U.-J., Wada M., Kuga S., Carbohydr. Polym. 2004, 56, 7–10. [Google Scholar]
- 6. Kim U.-J., Kuga S., Cellulose 2000, 7, 287–297. [Google Scholar]
- 7. Kobayashi M., Suzawa I., Ichishima E., Agric. Biol. Chem. 1990, 54, 1705–1709. [Google Scholar]
- 8. Kim U.-J., Lee Y. R., Kang T. H., Choi J. W., Kimura S., Wada M., Carbohydr. Polym. 2017, 163, 34–42. [DOI] [PubMed] [Google Scholar]
- 9. Han S., Lee M., J. Appl. Polym. Sci. 2009, 112, 709–714. [Google Scholar]
- 10. Lu T., Li Q., Chen W., Yu H., Compos. Sci. Technol. 2014, 94, 132–138. [Google Scholar]
- 11. Huang C., Xu Y. H., Chen J. L., Adv. Mater. Res. 2013, 796, 385–389. [Google Scholar]
- 12. Keshk S. M., Ramadan A. M., Bondock S., Carbohydr. Polym. 2015, 127, 246–251. [DOI] [PubMed] [Google Scholar]
- 13. Ruan C.-Q., Strømme M., Lindh J., Carbohydr. Polym. 2018, 181, 200–207. [DOI] [PubMed] [Google Scholar]
- 14. Mehdaoui R., El Ghali A., Cheikhrouhou W., Beyou E., Baouab M. H. V., Iran Polym. J. 2017, 26, 597–613. [Google Scholar]
- 15. Wu M., Kuga S., J. Appl. Polym. Sci. 2006, 100, 1668–1672. [Google Scholar]
- 16. Ghosh P., Dev D., Eur. Polym. J. 1996, 32, 165–171. [Google Scholar]
- 17. Han S., Lee M., Kim B. K., J. Appl. Polym. Sci. 2010, 117, 682–690. [Google Scholar]
- 18. Kimura S., Isobe N., Wada M., Kuga S., Ko J.-H., Kim U.-J., Carbohydr. Polym. 2011, 83, 1850–1853. [Google Scholar]
- 19. Liu P., Mai C., Zhang K., ACS Sustainable Chem. Eng. 2017, 5, 5313–5319. [Google Scholar]
- 20. Münster L., Vícha J., Klofáč J., Masař M., Hurajová A., Kuřitka I., Carbohydr. Polym. 2018, 198, 181–190. [DOI] [PubMed] [Google Scholar]
- 21. Plappert S. F., Quraishi S., Pircher N., Mikkonen K. S., Veigel S., Klinger K. M., Potthast A., Rosenau T., Liebner F. W., Biomacromolecules 2018, 19, 2969–2978. [DOI] [PMC free article] [PubMed] [Google Scholar]
- 22. Yan G., Zhang X., Li M., Zhao X., Zeng X., Sun Y., Tang X., Lei T., Lin L., ACS Sustainable Chem. Eng. 2019, 7, 2151–2159. [Google Scholar]
- 23. van de Ven T. G. M., Sheikhi A., Nanoscale 2016, 8, 15101–15114. [DOI] [PubMed] [Google Scholar]
- 24. Sirvio J., Hyvakko U., Liimatainen H., Niinimaki J., Hormi O., Carbohydr. Polym. 2011, 83, 1293–1297. [Google Scholar]
- 25. Liimatainen H., Sirviö J., Haapala A., Hormi O., Niinimäki J., Carbohydr. Polym. 2011, 83, 2005–2010. [Google Scholar]
- 26. Yang D., Peng X.-W., Zhong L.-X., Cao X.-F., Chen W., Sun R.-C., Cellulose 2013, 20, 2427–2437. [Google Scholar]
- 27. Zhang L. Y., Tsuzuki T., Wang X. G., Mater. Sci. Forum 2010, 654–656, 1760–1763. [Google Scholar]
- 28. Liimatainen H., Sirviö J. A., Kekäläinen K., Hormi O., Cellulose 2015, 22, 3151–3160. [Google Scholar]
- 29. Isogai T., Yanagisawa M., Isogai A., Cellulose 2009, 16, 117–127. [Google Scholar]
- 30. Ling Z., Wang T., Makarem M., Santiago Cintrón M., Cheng H. N., Kang X., Bacher M., Potthast A., Rosenau T., King H., Delhom C. D., Nam S., Edwards J. V., Kim S. H., Xu F., French A. D., Cellulose 2019, 26, 305–328. [Google Scholar]
- 31. Bruns R. E., Scarminio I. S., Neto B. d. B., Statistical Design: Chemometrics, Vol. 25, Elsevier, Amsterdam, 2005, pp. 1–412. [Google Scholar]
- 32. Rezende C. A., Atta B. W., Breitkreitz M. C., Simister R., Gomez L. D., McQueen-Mason S. J., Biotechnol. Biofuels 2018, 11, 206. [DOI] [PMC free article] [PubMed] [Google Scholar]
- 33. Ayeni A. O., Banerjee S., Omoleye J. A., Hymore F. K., Giri B. S., Deshmukh S. C., Pandey R. A., Mudliar S. N., Biomass Bioenergy 2013, 48, 130–138. [Google Scholar]
- 34. Meng Y., Wang X., Wu Z., Wan S., Young T., Eur. Polymer J. 2015, 73, 137–148. [Google Scholar]
- 35. Potthast A., Rosenau T., Kosma P., Saariaho A.-M., Vuorinen T., Cellulose 2005, 12, 43–50. [Google Scholar]
- 36. Leguy J., Nishiyama Y., Jean B., Heux L., ACS Sustainable Chem. Eng. 2019, 7, 412–420. [Google Scholar]
- 37. Sirviö J., Liimatainen H., Niinimäki J., Hormi O., Carbohydr. Polym. 2011, 86, 260–265. [DOI] [PubMed] [Google Scholar]
- 38. Koprivica S., Siller M., Hosoya T., Roggenstein W., Rosenau T., Potthast A., ChemSusChem 2016, 9, 825–833. [DOI] [PubMed] [Google Scholar]
- 39. Schmidt R., Scholze H. M., Stolle A., Int. J. Ind. Chem. 2016, 7, 181–186. [Google Scholar]
- 40. Nelson M. L., O'Connor R. T., J. Appl. Polym. Sci. 1964, 8, 1311–1324. [Google Scholar]
- 41. Odabas N., Amer H., Bacher M., Henniges U., Potthast A., Rosenau T., ACS Sustainable Chem. Eng. 2016, 4, 2295–2301. [Google Scholar]
- 42. Beaumont M., Kondor A., Plappert S., Mitterer C., Opietnik M., Potthast A., Rosenau T., Cellulose 2017, 24, 435–440. [Google Scholar]
Associated Data
This section collects any data citations, data availability statements, or supplementary materials included in this article.
Supplementary Materials
As a service to our authors and readers, this journal provides supporting information supplied by the authors. Such materials are peer reviewed and may be re‐organized for online delivery, but are not copy‐edited or typeset. Technical support issues arising from supporting information (other than missing files) should be addressed to the authors.
Supplementary