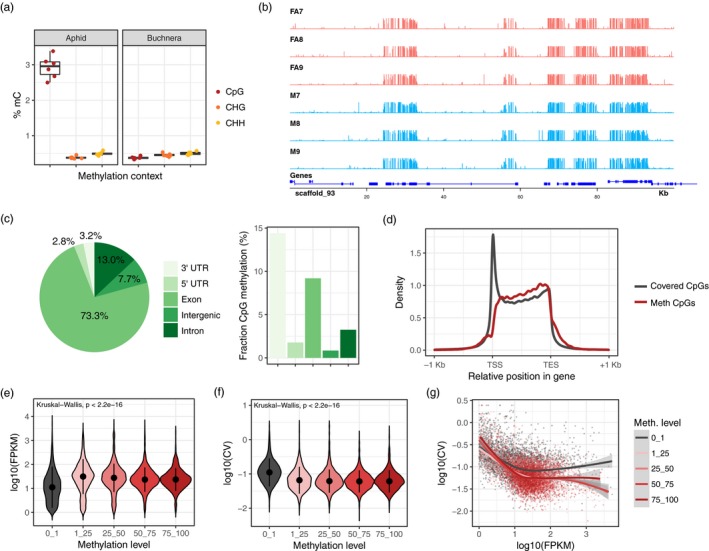
Figure 2.

The Myzus persicae methylome. (a) Boxplots indicate the proportion of methylated cytosines (mC) by sequence context (CpG, CHG and CHH) for M. persicae and its obligate endosymbiont Buchnera aphidicola, which lacks a functional methylation system. (b) Example genome browser view shows the distribution of CpG methylation in asexual females and males across the first 100 Kb of scaffold_93. (c) The distribution of methylated CpGs across genomic features and the proportion of methylated CpGs in each feature. Methylated and unmethylated CpG counts were summed across all replicates. (d) The distribution of all covered CpG sites (minimum of five reads per sample) and significantly methylated CpG sites (binomial test, BH‐corrected p < .05) across M. persicae gene bodies. TSS, transcription start site; TES, transcription end site. A large spike of covered CpG sites was observed at the TSS. However, the density of methylated sites at the TSS was low contrary to what is observed in plants and humans (Eckhardt et al., 2006). (e) The distribution of RNA‐seq expression levels in asexual females (log10 FPKM) for unmethylated (0%–1% CpG methylation) and methylated genes (grouped in methylation bins of 25% increments). FPKM, fragments per kilobase of transcript per million. Expression values were averaged across six biological replicates and methylation levels averaged across three biological replicates. Only genes with average expression levels of at least 1 FPKM in males and asexual females were included. Dots and whiskers inside the violin plots indicate median and interquartile range respectively. (f) As for (e) but showing the distribution of variation in expression between the six asexual female RNA‐seq replicates (measured as the log10 transformed coefficient of variation (log10 CV) of FPKM) for unmethylated (0%–1% CpG methylation) and methylated genes. (g) The relationship between the mean and the CV of gene expression for unmethylated and methylated genes with a trend line for each methylation level shown as a LOESS‐smoothed line with shaded areas indicating the 95% CI. The difference between the grey (unmethylated; 0%–1% CpG methylation) and pink/red lines (methylated; >1% CpG methylation) shows that methylation is associated with reduced between‐replicate variation in gene expression, particularly in highly expressed genes. The negative correlation and downwards slope of trend lines shows that higher expressed genes are better canalized, showing less between‐individual variation in gene expression [Colour figure can be viewed at http://wileyonlinelibrary.com]
