Figure 5.

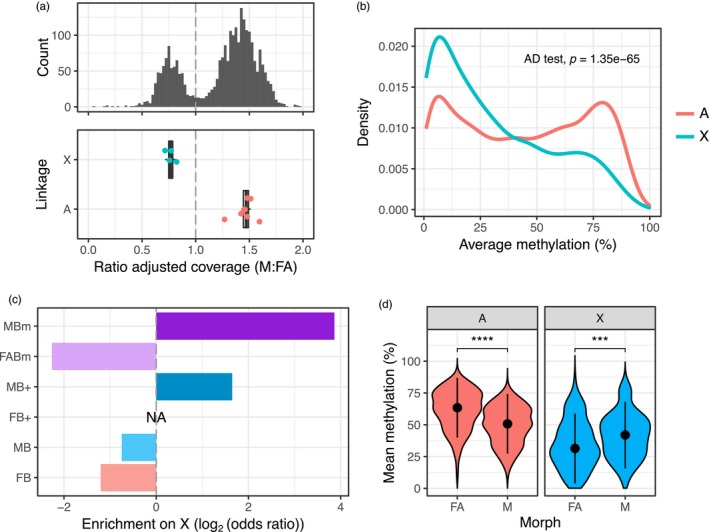
Distinct patterns of methylation and expression between the Myzus persicae X chromosome and autosomes. (a) X‐linked and autosomal scaffolds (≥20 Kb) in the M. persicae genome were identified based on the relative coverage of BS‐seq reads in males (M) compared to asexual females (FA). Given the XO sex determination system of aphids, X‐linked scaffolds are predicted to have half autosomal coverage in males. A bimodal distribution in the ratio of M to FA coverage is clearly visible (upper panel). We considered scaffolds falling in the lower coverage peak (ratio of adjusted coverage < 1) as X‐linked and scaffolds in the second, higher coverage peak (ratio of adjusted coverage > 1), as autosomal. The assignment of scaffolds to the X chromosome or autosomes was validated by comparing the M:FA ratio of coverage for scaffolds containing microsatellite markers on the X‐chromosome (blue dots) and autosome (red dots) (lower panel). (b) The distribution of gene body methylation levels for X‐linked and autosomal genes analysed in asexual females, averaged over all three replicates. (c) Observed/expected (odds ratio) counts of DM and DE genes on the X chromosome by expression or methylation bias category. The X chromosome is significantly enriched for genes with strongly male‐biased expression (MB+, ≥10‐fold upregulation in M) and genes with male‐biased methylation (MBm). (d) The distribution of mean methylation levels in asexual females (FA) and males (M) for X‐linked and autosomal DM genes (MethylKit; >10% methylation difference, BH corrected p < .05). Methylation levels are significantly higher in FA than M for autosomal genes, whereas M have a higher methylation than FA in X‐linked genes (d) dots and whiskers inside the violin plots indicate median and interquartile range, respectively; ***Wilcoxon signed‐rank test p < .001 ****p < .0001 [Colour figure can be viewed at http://wileyonlinelibrary.com]
