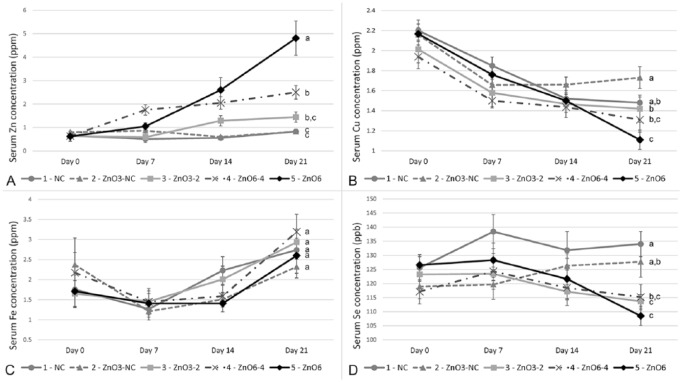
Figure 1.
Serum trace mineral concentrations over time. Graphs reflect mean serum concentrations (± SEM) of zinc (A), copper (B), iron (C), and selenium (D) by dietary treatment at days 0, 7, 14, and 21. At 21 d, concentrations not connected by the same letter are significantly different (p ≤ 0.05). Treatment groups: 1 (negative control [NC]; phase 1 and phase 2 containing 0 ppm ZnO); 2 (ZnO3-NC; 3,000 ppm ZnO in phase 1, then 0 ppm ZnO in phase 2); 3 (ZnO3-2; 3,000 ppm ZnO in phase 1, then 2,000 ppm ZnO in phase 2); 4 (ZnO6-4; 6,000 ppm ZnO in phase 1, then 4,000 ppm ZnO in phase 2); 5 (ZnO6; 6,000 ppm ZnO in phase 1, then 6,000 ppm ZnO in phase 2).

