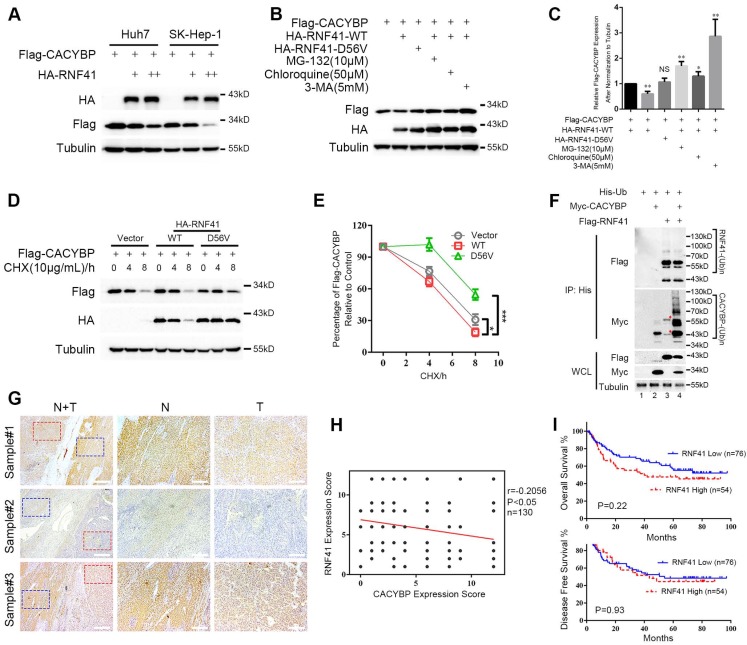
Figure 4.
RNF41 promotes the degradation of CACYBP. (A) Expression level of Flag-tagged CACYBP was steadily reduced with increasing amounts of RNF41 in Huh7 and SK-Hep-1 cells. (B) RNF41 with E3 ligase activity reduced the accumulation of exogenously expressed CACYBP, but this did not occur in the presence of the proteasome inhibitor MG132 or the lysosome inhibitors chloroquine or 3-MA. 293T cells were transfected with the indicated plasmids and incubated for 24 h. The cells were then incubated in fresh medium with none, 10 μM MG-132, 50 μM chloroquine, or 5 mM 3-MA for an additional 12 h. The cell lysates were analyzed by immunoblotting using the indicated antibody. Tubulin was used as a loading control. (C) Quantification of the expression level of Flag-tagged CACYBP after normalization to Tubulin. (D) Protein turnover of exogenously expressing Flag-tagged CACYBP in the presence of RNF41 WT or D56V mutant over the course of 8 h following the addition of 10 μg/mL cycloheximide. Tubulin was used as a loading control. (E) Quantification of the percentage of Flag-tagged CACYBP in the presence of RNF41 WT or D56V mutant for each time point compared to 0 h in (D). (F) RNF41 stimulates the poly-ubiquitination of CACYBP in vivo. 293T cells were transfected with the indicated plasmids and incubated for 24 h. Cell lysates were subjected to immunoprecipitation with His affinity nickel beads. Immunoblotting analysis was conducted for the indicated proteins. The red asterisks in lane 3 indicate nonspecific bands. (G) Representative images of RNF41 expression from the same sample slices used for examining CACYBP expression by immunohistochemistry analysis. Scale bar for the left column: 400 μm; Scale bar for the middle and right columns: 100 μm. T: tumor; N: non-tumor. (H) Scatterplot of expression scores of CACYBP vs RNF41 with a regression line showing a negative correlation. (I) RNF41 expression showed no significant association with OS (upper panel) and DFS (lower panel) in the HCC cohort according to Kaplan-Meier analysis. RNF41 high: 76 samples; RNF41 low: 54 samples. *P < 0.05; ***P < 0.001.

