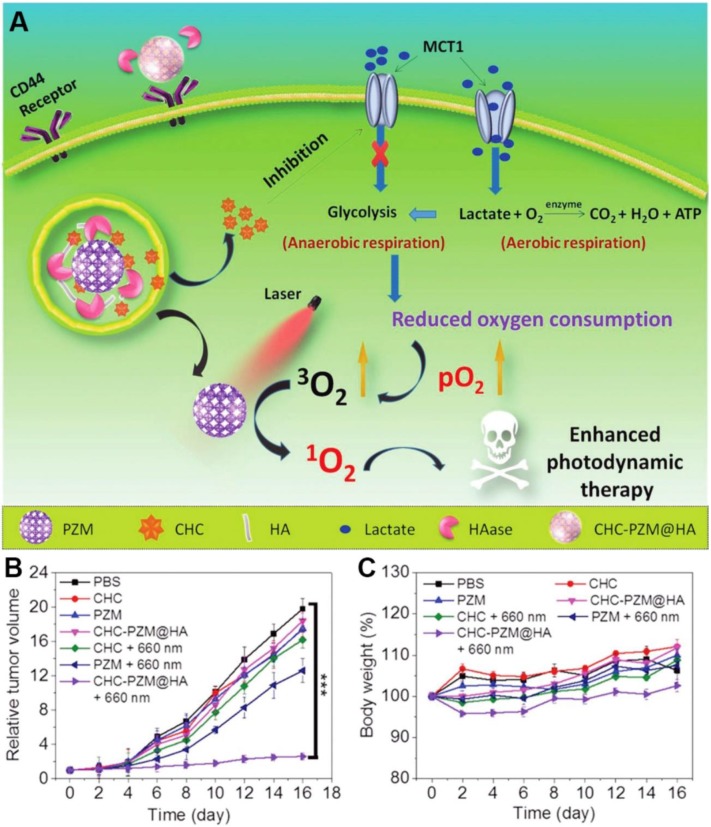
Figure 10.
Schematic illustration of porphyrinic MOF nanoplatform mediated suppressing lactate-fueled respiration for enhanced PDT therapy (A). Tumor volume changes (n=5). (B). and body weight curves (n=5). (C). Of CT26 tumor bearing mice after different treatments. All data points are presented as mean ± standard deviation (s.d.). (***P<0.001). Reproduced with permission from ref. 40. Copyright 2018, Wiley-VCH.

