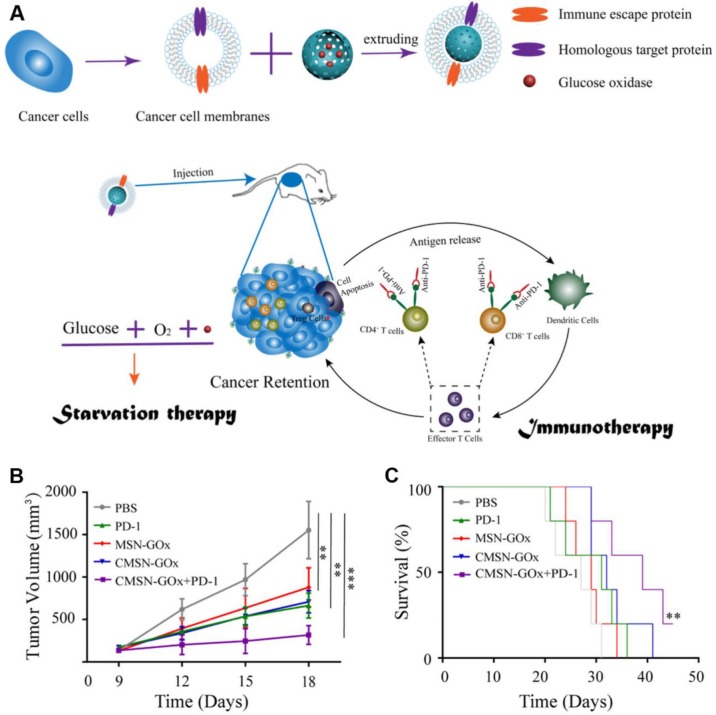
Figure 9.
Schematic illustration of CMSN-GOx induced cancer starvation/immunotherapy (A). Tumor volume changes (n=5). (B). and survival curves (n=5). (C). Of B16F10 tumor bearing mice after different treatments. All data points are presented as mean ± standard deviation (s.d.). (*P<0.05, **P<0.01, ***P<0.001). Reproduced with permission from ref. 47. Copyright 2019, American Chemical Society.

