Figure 7.
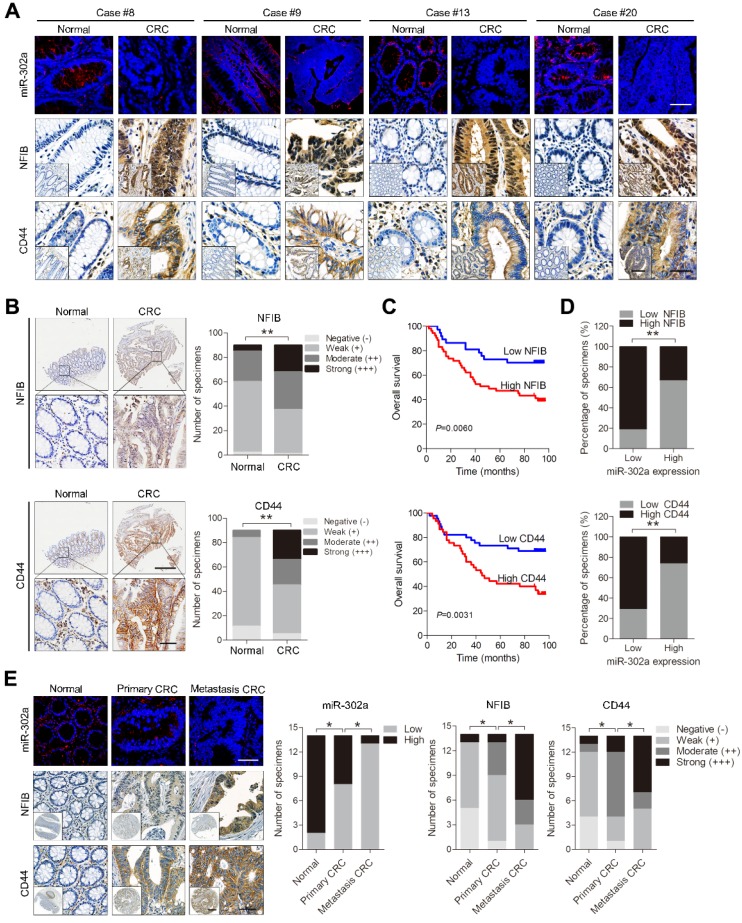
Expression of miR-302a, NFIB and CD44 in human CRC tissues. A Representative FISH images of miR-302a and corresponding IHC staining images of NFIB and CD44 from the 20 paired human CRC specimens and their adjacent normal tissues. Scale bar, 50 μm (FISH assays), 200 μm (inset) and 50 μm (main). B Representative images and analysis of IHC staining for NFIB and CD44 in 90 paired CRC specimens and their adjacent normal tissues. Scale bar, 500 μm (top) and 50 μm (bottom). **P<0.01, χ2 test. C Kaplan-Meier analysis of overall survival of CRC patients (n=90) according to high or low expression of NFIB and CD44. Significance determined by log-rank test. D The associations between miR-302a expression and NFIB or CD44 levels in 90 paired CRC specimens. **P<0.01, Spearman correlation. E Representative FISH images of miR-302a and corresponding IHC staining images of NFIB and CD44 in 14 pairs of primary CRC tissue and metastatic tissue. Scale bar, 50 μm (FISH assay), 500 μm (inset) and 50 μm (main). *P<0.05, χ2 test.

