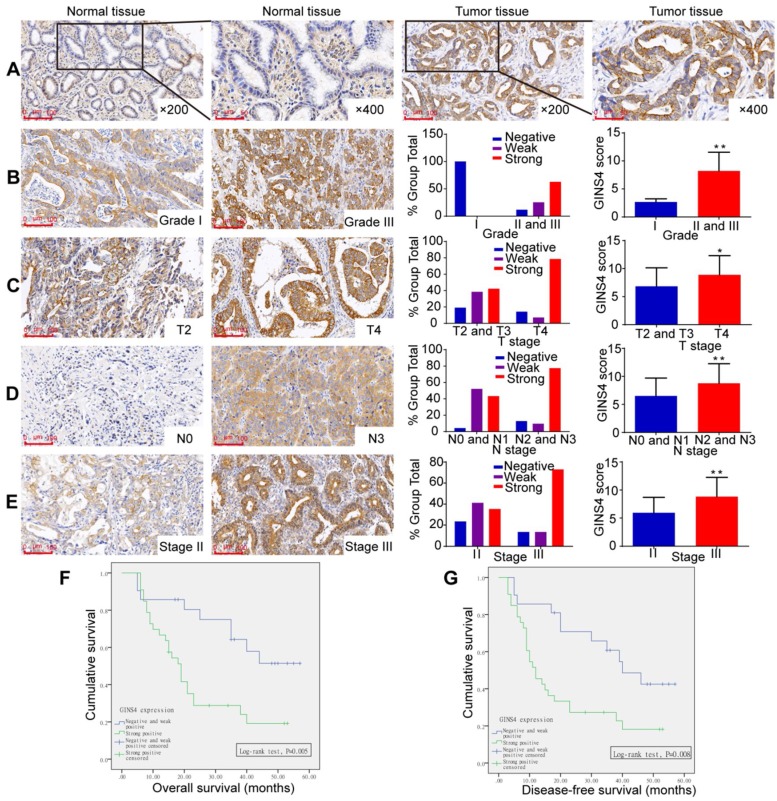
Figure 2.
GINS4 expression in the TMA and its correlation with clinicopathological features. The TMA, including 54 gastric cancer tissues and matched normal tissues, was stained with a specific anti-GINS4 antibody. A, Representative images of GINS4 expression in normal gastric tissues and matched gastric cancer tissues (200×, 400×). B-E, GINS4 expression between grade I vs grades II and III (B, P<0.01), T4 vs T2 and T3 (C, P<0.05), N0 and N1 vs N2 and N3 (D, P<0.01), and stage II vs stage III (E, P<0.01). F&G, The OS and DFS of patients with strong positive GINS4 expression vs those with negative/weak positive GINS4 expression. *P<0.05, **P<0.01.

