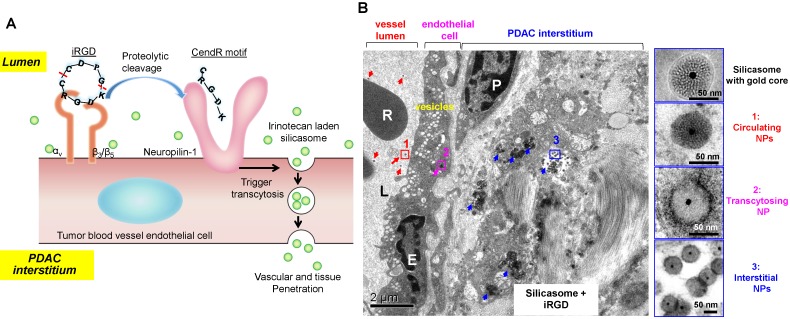
Figure 3.
(A) Schematic of the iRGD-mediated transcytosis mechanism for silicasome nanocarrier delivery in PDAC tumor. (B) Ultrastructural TEM views show iRGD co-administration mediated silicasome transcytosis process in orthotopic KPC tumor. The TEM image shows gold core labeled silicasomes in (i) the lumen of a tumor blood vessel (red arrows), (ii) transport in the endothelial vesicles (pink arrow), and (iii) deposition in the tumor interstitium (blue arrows). High-magnification images of regions 1 through 3 are provided in the panels on the right. E, endothelial cell; P, pericyte. Scale bar: 2 μm (left panel); 50 nm (right panels). Adapted with permission from ref.20.

