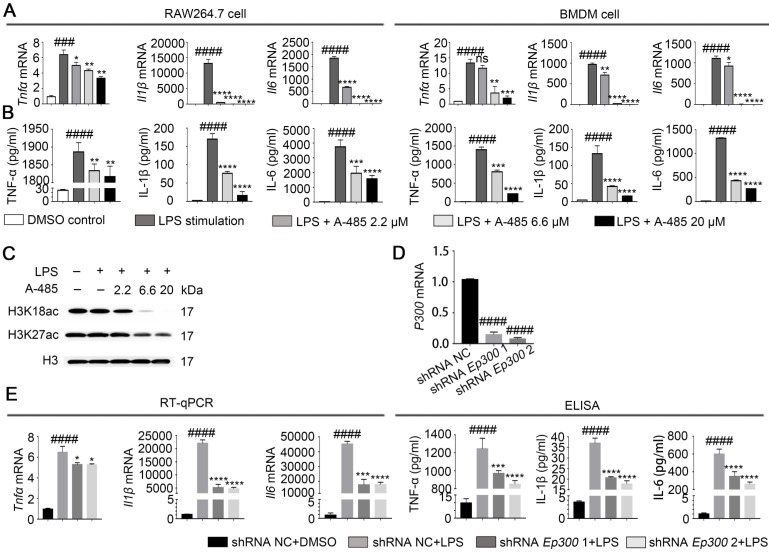
Figure 2.
A-485 inhibited inflammatory responses through inhibition of the catalytic function of p300. (A) RAW264.7 and BMDM cells were treated with LPS and A-485 for 4 h, after which the Tnfα, Il1β, and Il6 mRNAs were quantified by RT-qPCR analysis. (B) RAW264.7 and BMDM cells were treated with LPS and A-485 for 24 h. The TNF-α, IL-1β and IL-6 concentrations in culture supernatants were determined by ELISA. (C) Western blot analysis of H3K27 and H3K18 acetylation in LPS-challenged RAW264.7 cells. (D) The knockdown efficiency of shRNAs targeting Ep300 in RAW264.7 cells at the mRNA level. (E) RT-qPCR analysis of Tnfα, Il1β and Il6 mRNA in Ep300 knockdown and DMSO control RAW264.7 cells stimulated with LPS for 4 h (E, Left). TNF-α, IL-1β, and IL-6 concentrations in culture supernatants were detected by ELISA after stimulating with LPS for 24 h (E, Right). (n=3) Data are shown as mean ± SD. ns P>0.05, *P<0.05, **P<0.01, ***P<0.001 and ****P<0.0001 vs LPS group, ### P<0.001 and ####P<0.0001 vs control group.

