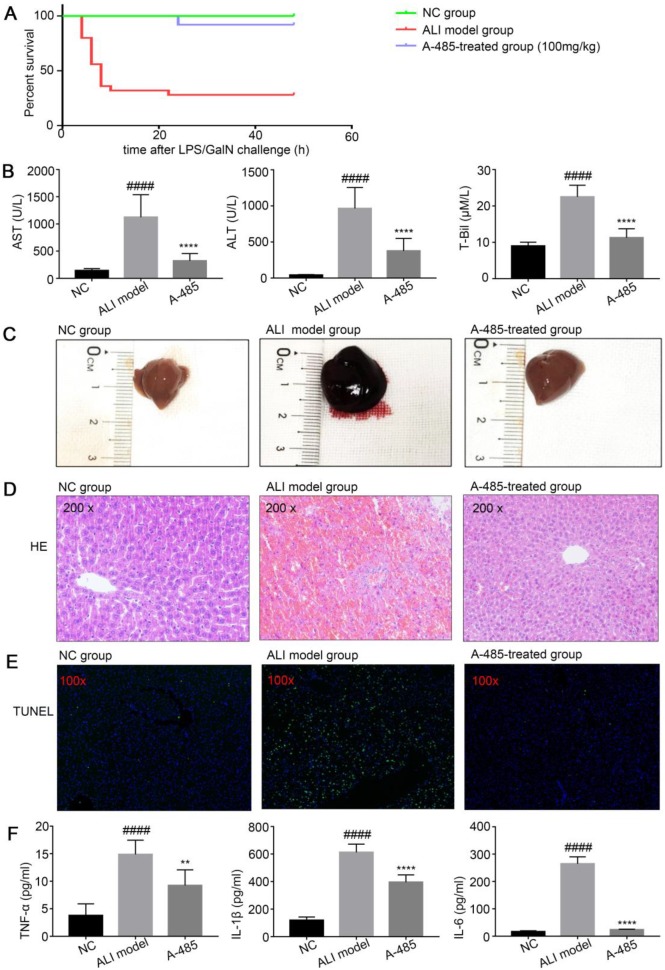
Figure 3.
A-485 exerted protective effects on the LPS/GalN-induced ALI model in mice. (A) Survival curves for mice from the NC group (n=15), ALI model group (n=25), and A-485-treated group (n=25). (B) Serum ALT, AST, and T-Bil in mice from the NC group, ALI model group, and A-485-treated group (n=15). (C) Morphological changes of livers in mice from the indicated groups. (D and E) Histological examination of liver tissues. H&E (D) and TUNEL (E) staining of liver tissues of mice from the indicated groups. (F) ELISA detected the TNF-α, IL-1β, and IL-6 concentrations in liver tissues (n=6). Data are shown as mean ± SD. ****P<0.0001 vs ALI model group, ####P<0.0001 vs control group.

