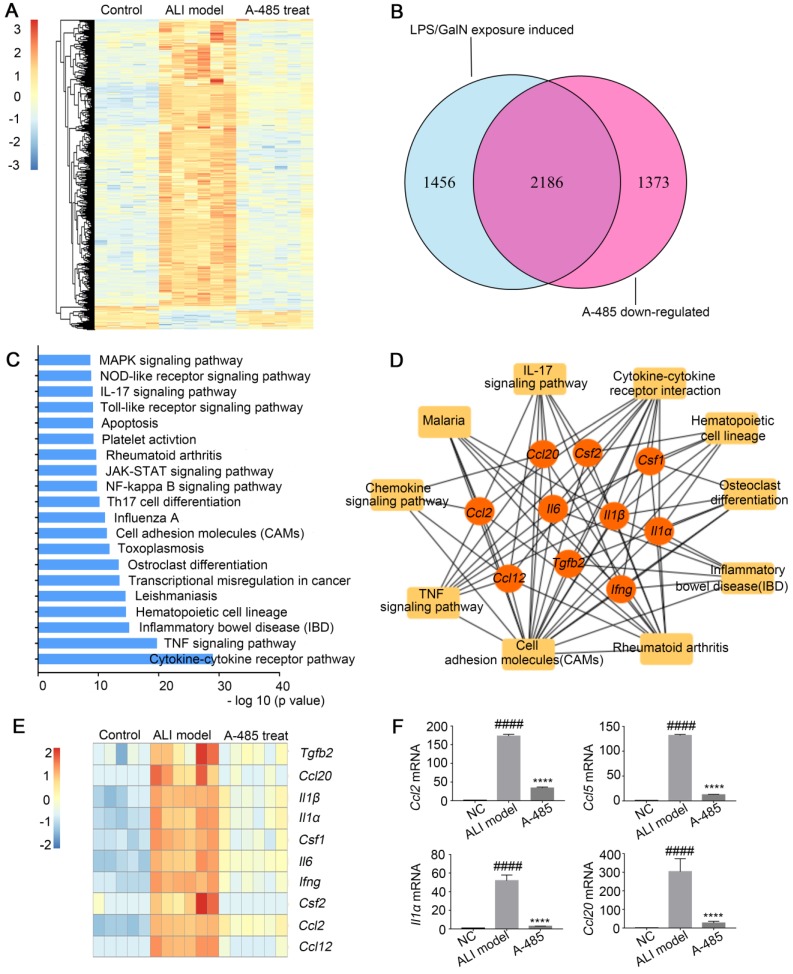
Figure 4.
A-485 regulated inflammatory gene expression in vivo as determined by RNA sequencing. (A-D) RNA-seq analysis was performed on liver tissues extracted from mice in the control (n=5), ALI model (n=6), and A-485-treated groups (n=6). (A) The heat map of genes with adjusted P value <0.05, and absolute value of log2 fold-change >1.5. (B) Venn diagram showing the overlap between the gene set of LPS/GalN-induced upregulated genes and the gene set subsequently downregulated by A-485 in vivo. (C) KEGG pathway analysis using differentially expressed genes between the LPS/GalN-exposed ALI group and the control group, showing that the most significantly enriched pathways are related to the inflammatory response. (D) Visualization of inflammation network and top 10 hub genes. Inflammatory gene network was constructed by mapping genes from the top 10 most significantly affected pathways to the PPI network using Maximal Clique Centrality method. (E) Heat map of top 10 hub genes. (F) RT-qPCR analysis was performed to validate the repression of hub genes by A-485 (n=5). Data are shown as mean ± SD. ****P<0.0001 vs ALI model group, ####P<0.0001 vs control group.

