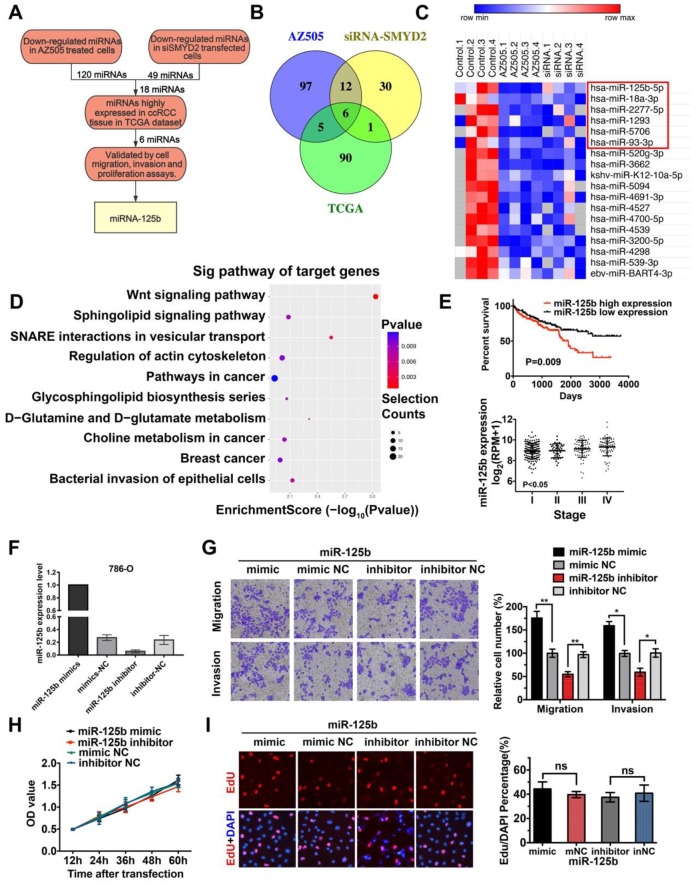
Figure 3.
Identification of miRNAs correlated with SMYD2 inhibition. (A) The flowchart for screening SMYD2 inhibition-related miRNAs. (B) Venn representation of the overlaps among downregulated miRNAs in the AZ505-treated cells, downregulated miRNAs in the siSMYD2-transfected cells, and upregulated miRNAs in the ccRCC samples from the TCGA. (C) Heatmap of 18 dysregulated miRNAs in both the AZ505-treated and SMYD2-knockdown cells; the 6 potential downregulated tumor-activating miRNAs are shown in the red box. (D) Functional enrichment results of the predicted target genes of the six candidate miRNAs by Gene Ontology and KEGG analysis. (E) Kalpan-Meier overall survival curves of ccRCC patients according to the TCGA data for the expression level of miR-125b (P = 0.009, log-rank). The stage of ccRCC patients was correlated with their miR-125b expression (P < 0.05, one-way ANOVA). (F) miR-125b expression level in 786-O cells after their transfection with the miR-125b mimics or inhibitors. (G) Migration and invasion analyses (Transwell) assays for 786-O cells transfected with the miR-125b mimic or inhibitor and the corresponding control sequence. The number of migrated cells was counted in five random images in case of samples from each treatment group. (H) MTS assays for 786-O cells transfected with the miR-125b mimics, miR mimic NC, miR-125b inhibitor, or miR inhibitor NC. (I) Representative micrographs and quantification of EdU-incorporated cells from the indicated cell lines. ns, not significant.

