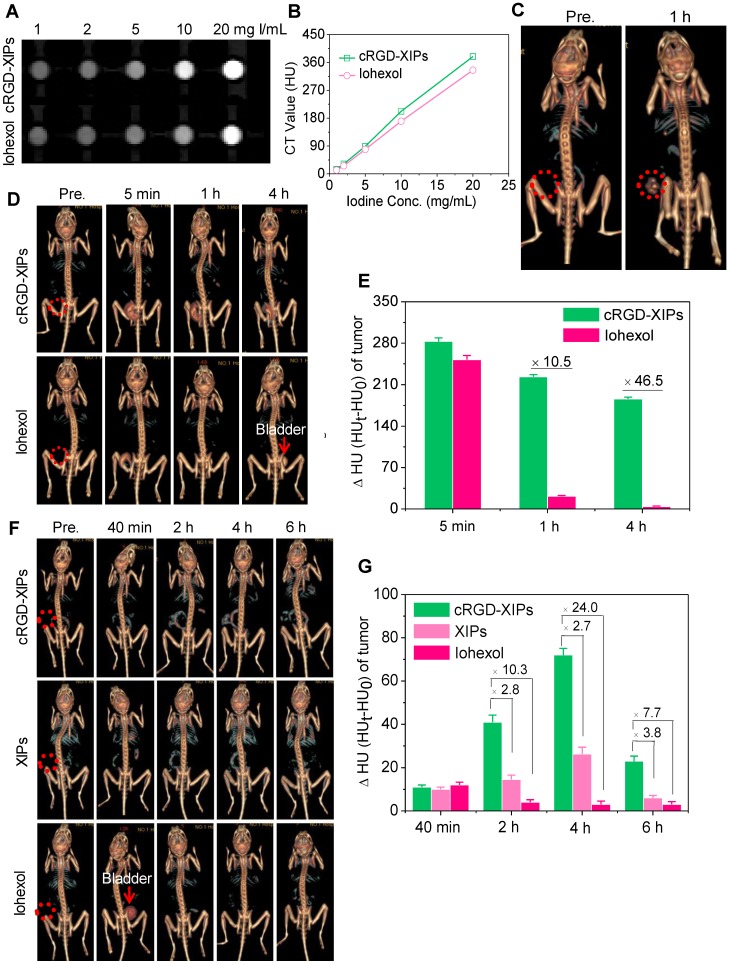
Figure 4.
CT images (A) and X-ray attenuation (B) of iohexol and cRGD-XIPs solutions as a function of iodine concentrations. (C) 3D reconstruction CT images of tumors in mice before and 1 h after it administration of cRGD-XIPs or iohexol. 3D reconstruction CT images (D) and enhanced CT attenuation (ΔHU) (E) of the tumors before and at 5 min, 1 h or 4 h after it injection of cRGD-XIPs or iohexol. 3D reconstruction CT images (F) and ΔHU (G) of the tumors before and at different time post iv injection of cRGD-XIPs, XIPs or iohexol. The red dotted circles in B, D and F indicate the tumor areas. The iodine dose was set at 350 mg I equiv./kg for C-G.

