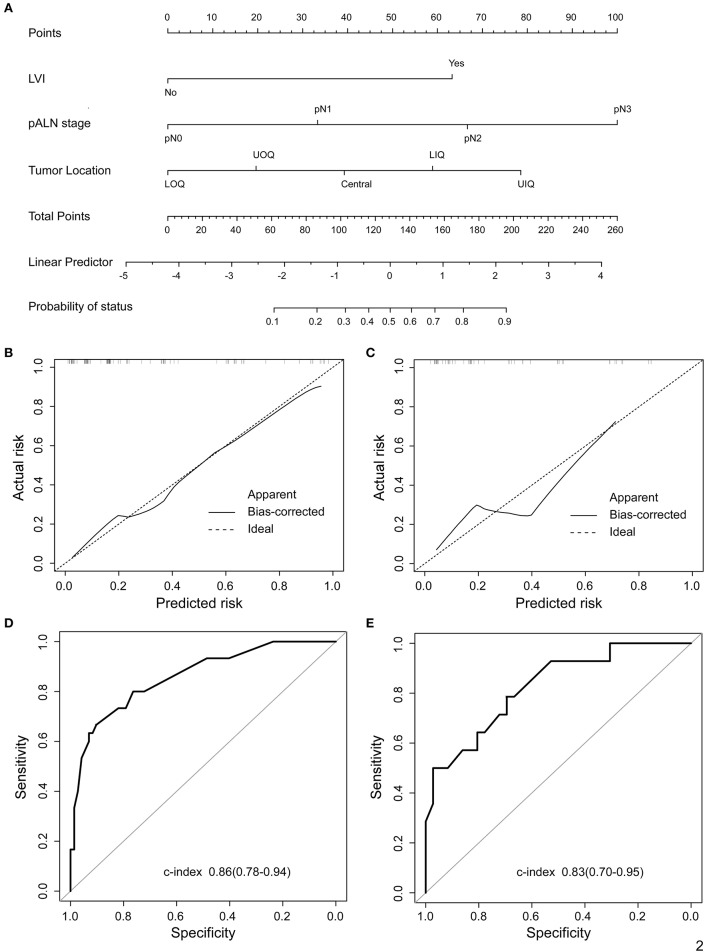
Figure 2.
Proposed nomogram to predict the probability of IMLN metastasis after mastectomy in patients with breast cancer. (A) Nomogram was build to predict IMLN status for BC patients, with the tumor location, LVI and pALN stage incorporated. Calibration plots for nomogram model in (B) training cohort and (C) validation cohort. The dashed line (the 45-degree line) represents a perfect prediction nomogram, and the black solid line represents the observed nomogram, of which a closer fit to the dashed line means a better prediction model. Plots (D) and (E) show the ROC curves of the constructed nomogram in the training and validation cohorts, respectively. UIQ, upper inner quadrant; LIQ, lower inner quadrant; UOQ, upper outer quadrant; LOQ, lower outer quadrant.

