
Figure 3.
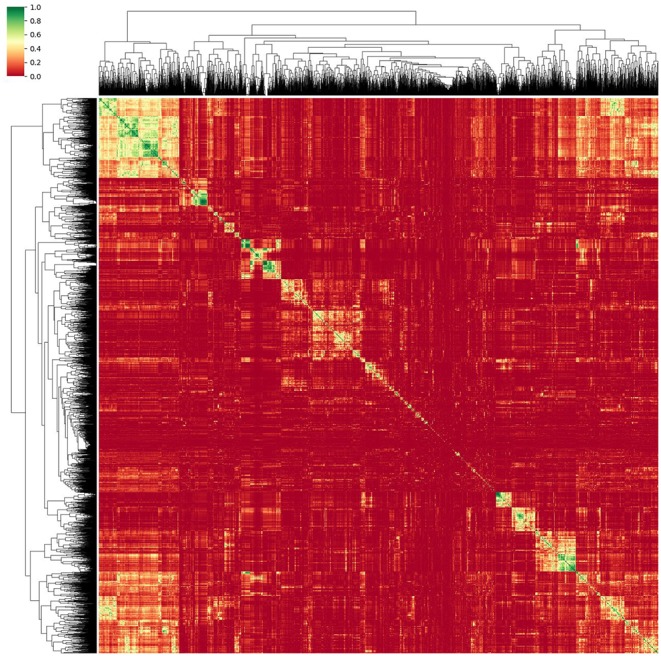
Reordered correlation matrix and obtained dendrogram of the radiomic features obtained from the normalized MRI images. Green designates strongly correlated features while red indicates an r2 close to zero.
Official websites use .gov
A
.gov website belongs to an official
government organization in the United States.
Secure .gov websites use HTTPS
A lock (
) or https:// means you've safely
connected to the .gov website. Share sensitive
information only on official, secure websites.
Reordered correlation matrix and obtained dendrogram of the radiomic features obtained from the normalized MRI images. Green designates strongly correlated features while red indicates an r2 close to zero.