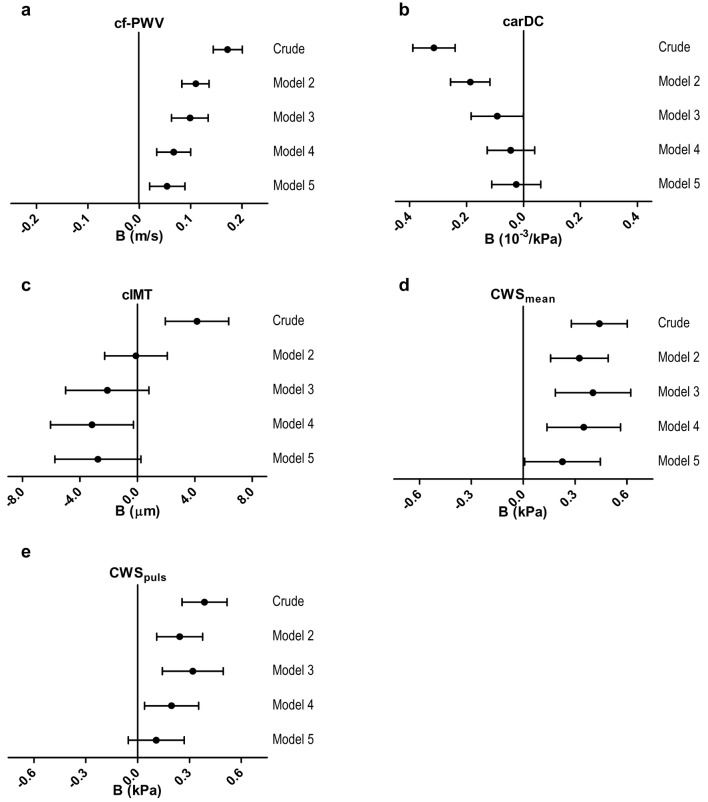
Fig. 2.
Multivariable-adjusted associations of incremental glucose peak (IGP) and arterial stiffness and arterial remodeling. Regression coefficients (B) indicate the mean difference (95% confidence interval) associated with 1 unit (mmol/L) increase of IGP. The panels depict the a associations between IGP and carotid-femoral pulse wave velocity (cf-PWV); b associations between IGP and carotid distensibility coefficient (carDC); c associations between IGP and carotid intima-media thickness (cIMT); d associations between IGP and mean circumferential wall stress (CWSmean); e associations between IGP and pulsatile circumferential wall stress (CWSpuls). Model 1: crude. Model 2: additionally adjusted for age and sex. Model 3: additionally adjusted for HbA1c. Model 4: additionally adjusted for mean arterial pressure and mean heart rate (cf-PWV), mean arterial pressure (carDC, CWSpuls), office systolic blood pressure (cIMT) or carotid pulse pressure (CWSmean). Model 5: additionally adjusted for body mass index, smoking status, physical activity, Mediterranean diet score, use of antihypertensive and lipid-modifying drugs, fasting triglycerides, and total-to-HDL cholesterol levels

