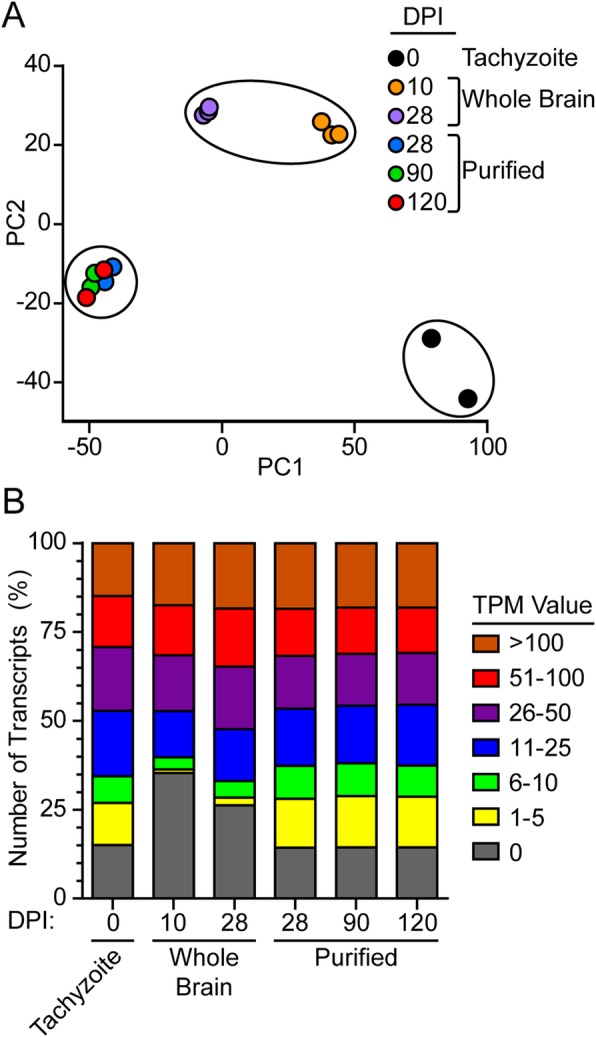
Fig. 4.

RNA-seq samples group with experimental design and with infection state. a PCA plot from normalized values calculated by DESeq2. Symbol colors represent: tissue culture tachyzoites (black); whole brain acute infection (orange); whole brain chronic infection (purple); purified at 28 days (blue); purified at 90 days (green); purified at 120 days (red). b Percent of transcripts with TPM values within each range: 0 (grey), 1–5 (yellow), 6–10 (green), 11–25 (blue), 26–50 (purple), 51–100 (red), and > 100 (brown)
