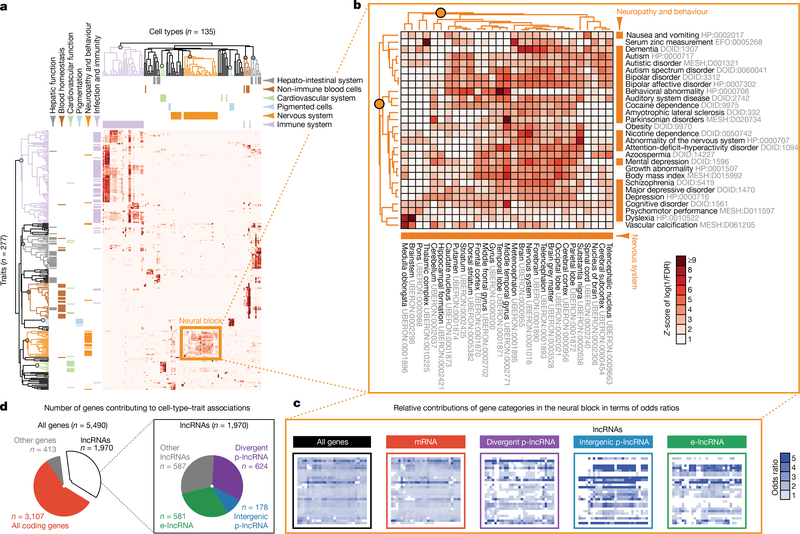
Figure 2 |. Cell-type-specific lncRNAs implicated in GWAS traits.
a, Unsupervised clustering of cell types and traits based on the association of cell-type-enriched genes with trait-associated genes. All lncRNAs and all other genes were used. Only cell types and traits involved in significantly associated cell-type-trait pairs were plotted. Intensity represents the level of association measured as Z-score of the log-transformed FDR reciprocal in one-tailed Fisher’s exact test. Cell types and traits were clustered on the basis of the Z-score. Selected cell types and traits of six matching themes were colour-coded accordingly. Clusters for specific themes are highlighted in the dendrograms (Extended Data Fig. 7 for detailed views). b, Detailed view of the neural block, showing significant association of genes enriched in nervous system tissues and genes associated with neuropathy and behaviour traits. c, Contributions of gene categories within the neural block. Odds ratios were calculated on the basis of all genes, or other gene categories as indicated. d, Number of genes contributing to significantly associated cell-type-trait pairs.

