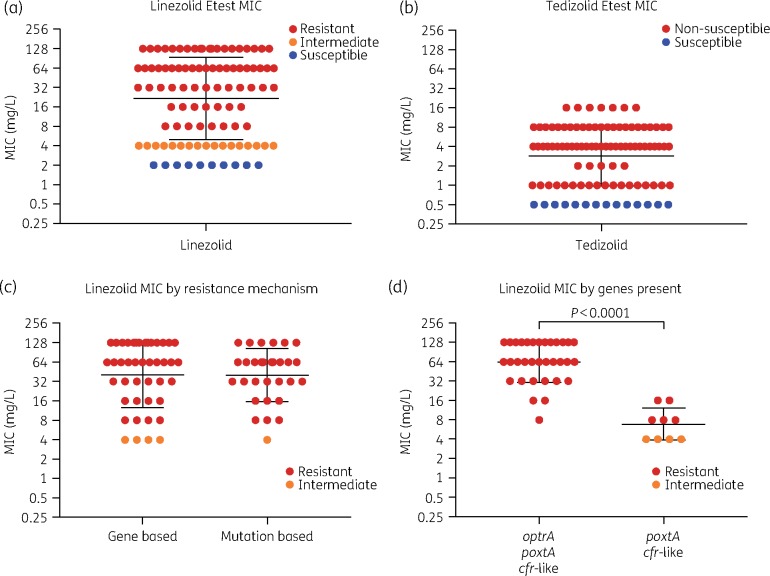
Figure 2.
Linezolid and tedizolid MICs and comparisons by basis of resistance mechanism. The geometric mean MIC of linezolid (a) is higher than the geometric mean MIC of tedizolid (b) at 21.83 and 2.87 mg/L, respectively. There was no difference in linezolid resistance between isolates with gene- or mutation-based resistance mechanisms (c). However, isolates that harboured poxtA and cfr-like genes had significantly lower levels of linezolid resistance than those that harboured all three linezolid resistance genes (d); statistical analysis was done using the unpaired t-test in Prism v8. Please note, y-axis values for all graphs are log2 scaled for visual acuity.

