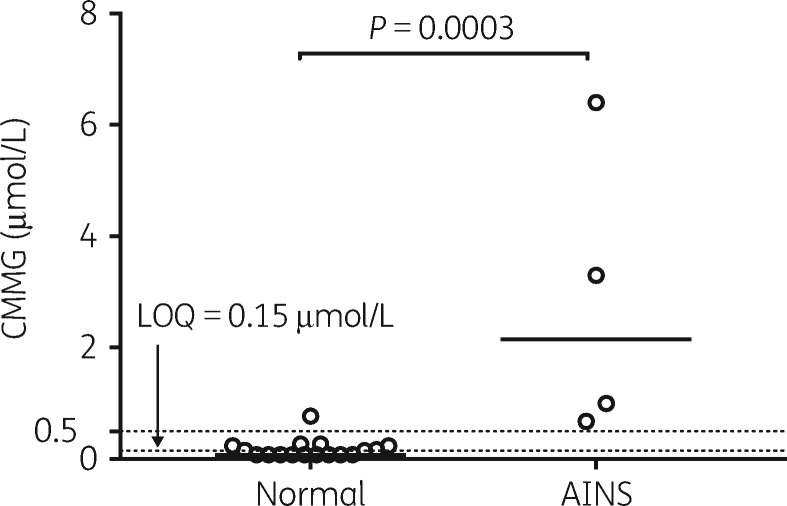
Figure 4.
Comparison of peak CMMG concentrations in CSF samples from patients (n=21) treated with aciclovir for herpesvirus CNS infection. Comparison is made between patients with (n=4) and without (n=17) suspected AINS, previously associated with CMMG >0.5 μmol/L (upper dotted horizontal line). Bar is set at the median. The lower dotted horizontal line represents the CMMG analysis limit of quantification (LOQ) of 0.15 μmol/L.

