Figure 3.
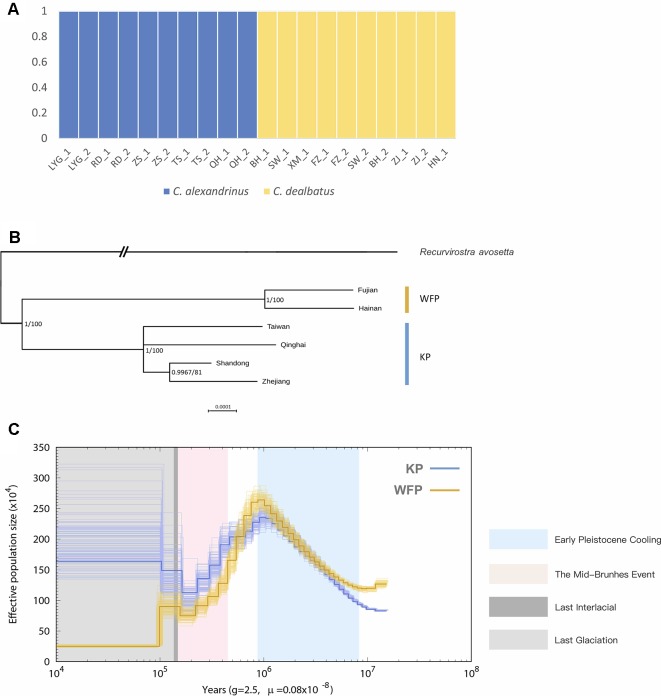
Population genetic structure and historical demography. C. alexandrinus marked in blue and C. dealbatus in yellow. (A) Genetic clustering inferred with ADMIXTURE when K = 2. (B) Phylogenetic relationship between the C. dealbatus (WFP) and different populations of C. alexandrinus (KP) using Bayesian and Maximum Likelihood methods based on mitochondrial genome sequences (c.a. 15kb). Posterior probabilities (pp) and bootstrap supports are indicated at each node. White-faced plover and Kentish plover form two independent evolutionary lineages. (C) Demographic history of the Kentish plover, blue line, and white-faced plover, yellow line reconstructed from the reference and population resequencing genomes. The line represents the estimated effective population size (N e), and the 100 thin blue curves represent the PSMC estimates for 100 sequences randomly resampled from the original sequence. Generation time (g) = 2.5 years, and neutral mutation rate per generation (μ) = 0.8 × 10⁻⁸. The Last Interglacial period (LIG, from approx. 130 to 116 ka) is marked by a grey block.

