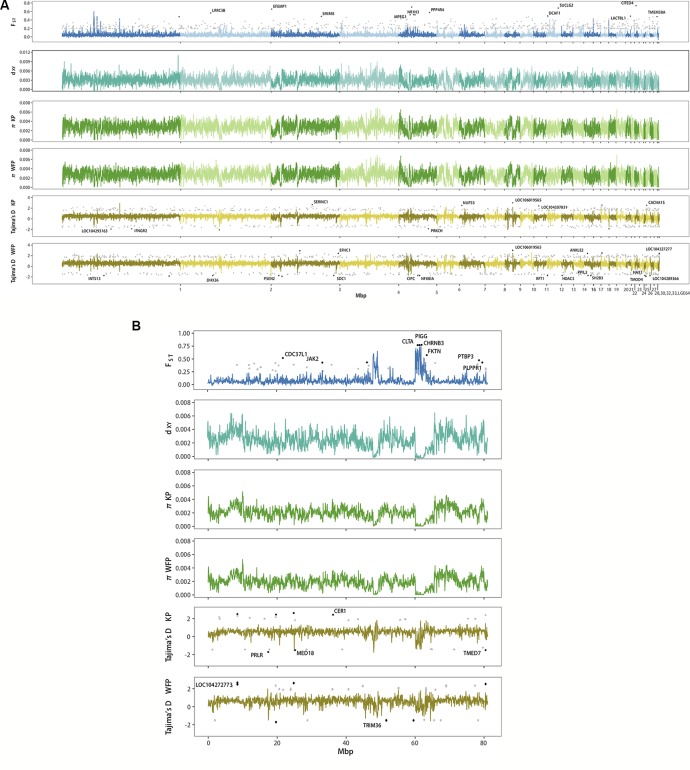
Figure 4.
Genome wide landscape of F ST, d XY, π, and Tajima’s D for 50 kb sliding window. Different autosomes are marked with alternating light and dark colors. (A) Genome wide landscape for autosomes. Ninety-fifth percentile outliers are plotted for F ST and 95th/5th percentile outliers are plotted for Tajima’s D in grey, as calculated per gene. Ninety-ninth percentile outliers for F ST and 99.9th/0.1th percentile outliers for Tajima’s D are plotted in black per gene and labelled with gene symbols. (B) Genome wide landscape for Z chromosome. Ninety-fifth percentile outliers are plotted for F ST and 95th/5th percentile outliers are plotted for Tajima’s D in grey, as calculated per gene. Ninety-ninth percentile outliers for F ST and 99th/1st percentile outliers for Tajima’s D are plotted in black per gene and labelled with gene symbols.

