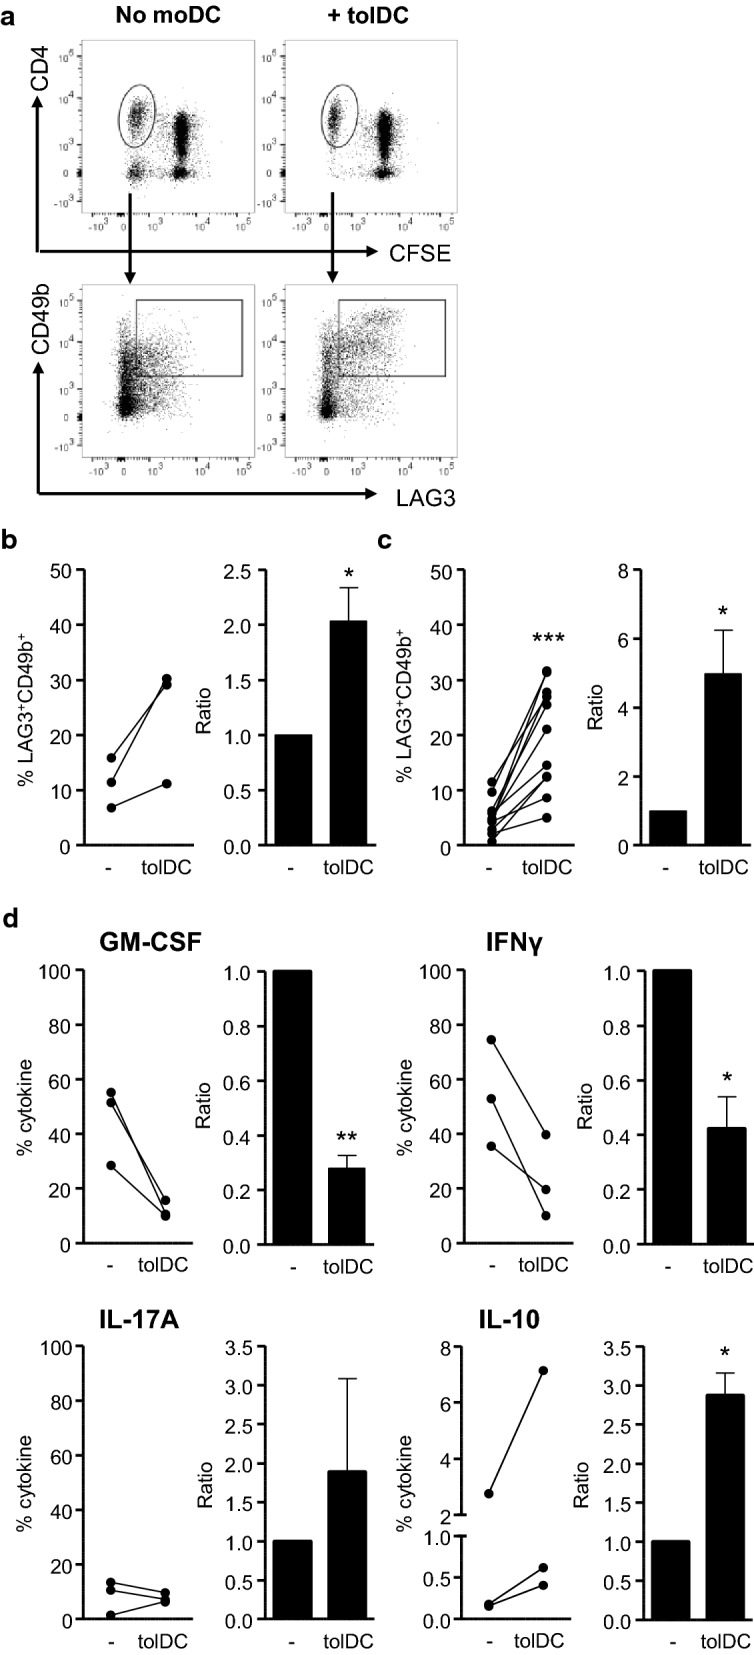
Fig. 4.

tolDC tolerise the HSP-specific T-cell response. Cell proliferation dye (CFSE/CTV)-labelled PBMC of IA patients were cultured with an HSP-peptide pool (HSP60p1, HSP60p2 and B29; 4 μg/ml per peptide) (a, b, d) or CA (1:1000) (c) and tolDC (tolDC) or without addition of any type of moDC (-) for 9 days. a–c Percentages and ratios of LAG3 and CD49b in CFSE/CTV− life CD4+ T-cells were measured using flow cytometry. Gating strategy (a) HSP-peptide graphs (b) and CA graphs (c) are shown. Ratios were measured by dividing the percentage of CFSE/CTV− CD4+ T-cells of tolDC cultures by the percentage of CFSE/CTV− CD4+ T-cells of non-moDC cultures. d Percentages of GM-CSF, IFNγ, IL-17A and IL-10 in CFSE/CTV− life CD4+ T-cells were measured after stimulation with PMA (50 ng/ml) ionomycin (1 μg/ml) and brefeldin A (1 μg/ml for 5 h by using flow cytometry. One-tailed (IL-10 and LAG3/CD49b) or two-tailed (all other) paired Student T-test was used. *p ≤ 0.05, **p ≤ 0.01, ***p ≤ 0.001
