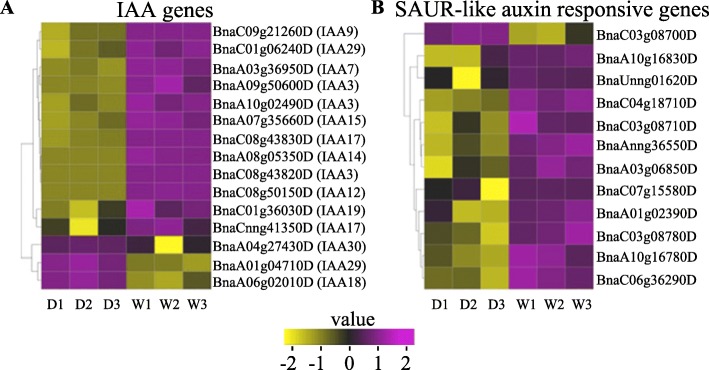
Fig. 7.
The heatmap of genes that are involved in auxin signaling transduction pathway showing up-regulation (purple) and down regulation (yellow) in dwarf mutants (D1, D2, D3) and WT (W1, W2, W3). Color key represents log2 transformed FPKM (fragments per kilo base of exon per million fragments mapped) values, from low (yellow) to high (purple). SAUR (small auxin up RNAs)

