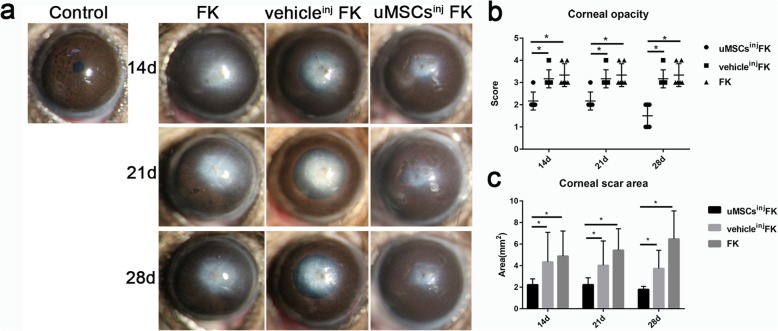
Fig. 2.
Ocular surface observation and examination. (a) Slit-lamp microscope observation and photograph of control group, FK group, vehicleinj FK group and uMSCsinj FK group. (b) Statistical analysis of corneal opacity scores. (c) Statistical analysis of corneal scar formation area (mm2) between groups. Magnification of ocular surface photos: 25×. Values are presented as means ± SD, n = 12, *P < 0.05

