Fig. 4.
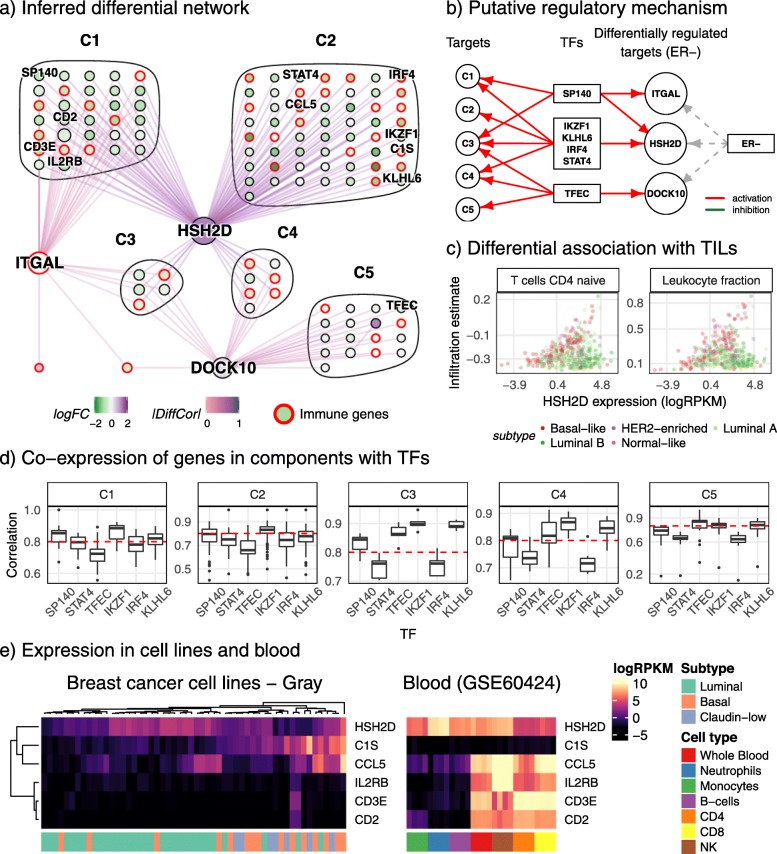
A DC sub-network in ER− tumours is associated with lymphocyte infiltration. a The DC sub-network with candidate differentially regulated targets DOCK10, HSH2D, and ITGAL, and TFs TFEC, SP140, IKZF1, KLHL6, IRF4, and STAT4. Nodes are coloured based on log fold-change conditioned on ER status and edges coloured based on differences in correlations. Genes are clustered based on the target they are differentially co-expressed with. b A putative regulatory mechanism proposed from the DC network with insights gained from simulations. Dashed lines indicate a potentially indirect yet causal interaction. c Differential association of HSH2D with tumour-infiltrating lymphocytes (TILs) with infiltration estimated from a naïve T cell signature using singscore (left), and from H&E-stained slides (Saltz. Gupta, et al.). Associations indicate that HSH2D is a marker of lymphocyte infiltration specific to basal-like tumours. d correlations of genes in clusters C1-C5 with all transcription factors. The red line indicates a correlation of 0.8, showing stronger co-expression with TFs in the same cluster. e Expression of selected genes in cancer cell lines annotated with cancer sub-type and blood data annotated with immune cell type. Genes in the DC network have high expression in blood and are rarely expressed in cell lines

