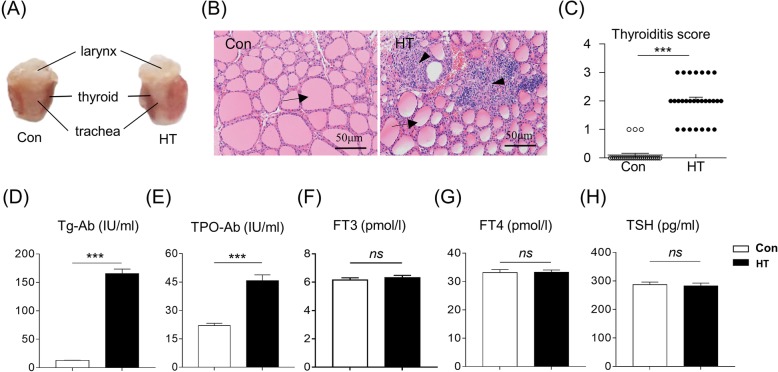
Fig. 1.
Building a euthyroid HT mouse model on Day E4.5. a Representative macroscopic images of thyroid glands from Con mice and HT mice. b Histology of the thyroid detected by HE staining at magnification × 200. Arrow: thyroid follicle; Arrowhead: infiltrated monocytes. c-e Levels of thyroiditis-related parameters. c Quantitation of the degree of monocyte infiltration in thyroids (Mann-Whitney test), d Serum anti-Tg, e Serum anti-TPO. f-h Serum levels of thyroid function-related parameters. f FT3, g FT4, h TSH. Data are presented as the mean ± SEM, n = 28; ns, not significant; ***p < 0.001, vs. Con

