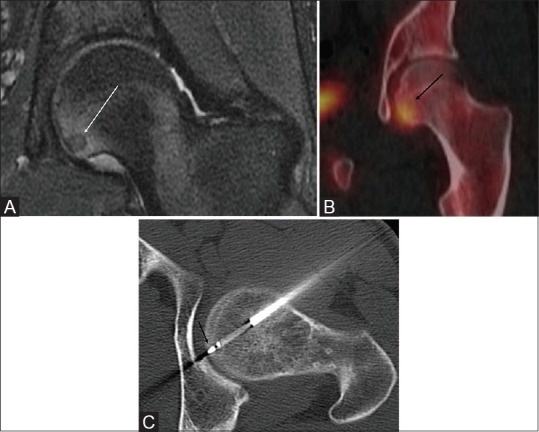
Figure 3 (A-C).

(A) Coronal fat-sat PD MR of the left hip shows a hypointense subchondral OO with adjacent marrow edema (white arrow). (B) SPECT/CT shows focal uptake within the lesion (black arrow). (C) Axial procedural CT showing the lateral approach for the RFA avoiding the femoral head articular cartilage and neurovascular bundle. RF probe in the nidus (black arrow)
