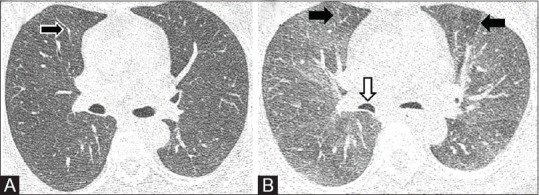
Figure 3 (A and B).

NCCT variants. (A) Inspiratory scan showing mild mosaic attenuation (arrow). (B) Expiratory CT performed in low dose shows multiple areas of air trapping (black arrows). Note the bowing of posterior walls of bronchi suggesting adequate expiratory phase (white arrow)
