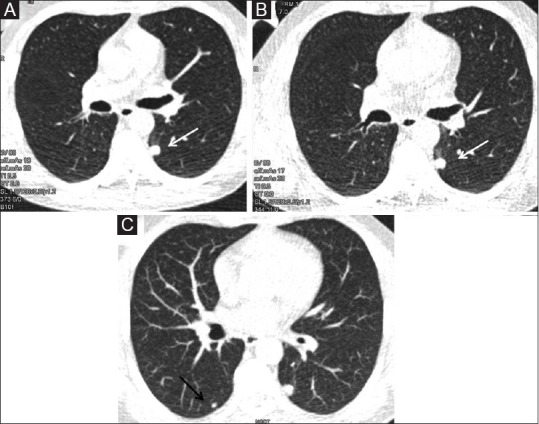
Figure 5 (A-C).

Low dose CT (LDCT) nodule follow-up. (A). LDCT done in a 46-year old chronic smoker shows a nodule in left lower lobe (white arrow).(B) Follow-up LDCT done 6 months later shows no interval change in size. (C) Axial maximum intensity projection (MIP) image in lung window shows another smaller nodule (black arrow) in right lower lobe in addition to left lower lobe nodule
