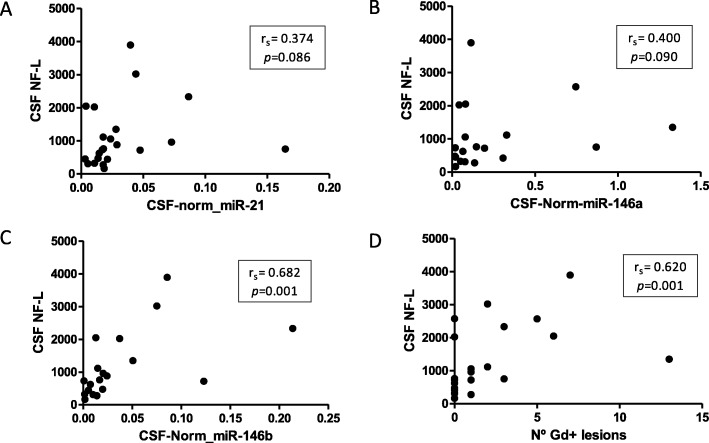
Fig. 2.
Scatter plot of correlation between NF-L in CSF. Scatter plots showing the relationship between NF-L levels in CSF and expression levels of miR-21 (a), miR-146a (b), miR-146b (c), and number of Gd+ lesions (d). Significant positive correlations were observed in all cases, illustrating a link between axonal damage and candidate miRNAs expression. rs: Rho Spearman; p: p value

